Tuesday, December 22nd, 2020 and is filed under AI Insight News
AI Insight CEO Sherri Cooke discusses her key reflections for 2020 including how alternative investments played an important role in portfolios and the impacts of Reg BI. She also shares what’s anticipated in 2021. Read the narrative below or listen to the podcast here.
Sherri formed AI Insight in 2005 with the primary goal of providing the financial planning community with a more efficient and consistent way to access factual information on alternative investment programs – and from that vision the AI Insight database was born.
Q: What are some of the key reflections you have about 2020 and some points of interest for the coming year?
SC: I would say as a ADISA Board member, I was fortunate to be able to spend quite a bit of time this year collaborating with others in the alternative investment industry focusing on some of the things we can do to make the industry better – and to increase the awareness and understanding of these products within a growing audience. I believe we all have to work together to bring this space to a whole new level. Also, as Reg BI requirements continue, we’re looking at ways to partner with compliance and technology workflow companies that are helping to support these needed processes. We’re also looking to connect with other companies – both inside and outside the traditional alternatives space to further increase consistency and transparency in the industry with an ultimate goal of making it easier to conduct alts business.
Q: How do you think alternative investments played an important role in portfolios this past year, especially given the pandemic?
SC: We’re always looking for ways to give more to people – who are of course qualified – access to alternative investments to help them really diversify their portfolio in a meaningful way. Our belief is that a person isn’t fully diversified if all of their underlying investments are either in some way tied to the markets or are invested in a fixed income security – which is effectively still tied to the market.
Despite the pandemic – and in some cases as a result of – there are a lot of really solid opportunities to invest in real assets, interesting investment structures, and institutionally supported opportunities through alternative investments that really provide true diversification.
That said, alternatives can certainly be complex and they need to be factually understood and appropriately sold. This industry really needs to educate financial professionals and investors in so many different ways. One of those has to be around creating realistic expectations about what these investments are intended to bring to a diversified investment portfolio…and what they are not. Stocks lose value all the time and there will be alts that don’t perform. As an industry, we really need to do our very best to ensure that these products are properly sold and positioned within client portfolios. And – as with all investments – we support conducting the best possible research and diligence to allow firms and advisors to select best of class – and help the vested financial firms and producers drive product sponsors toward best of class practices.
Q: We know that compliance is often an issue for advisors in considering alternative investments – and regulatory scrutiny continues to increase. The SEC’s Regulation Best Interest implementation took place on June 30. How does AI Insight help streamline Reg BI requirements?
SC: Compliance is one of the things that motivated me to create AI Insight in the first place. I wanted to build capabilities to facilitate due diligence and proper compliance along with education and documentation of these efforts when selling complex products – those products that the regulators have called out as needing heightened supervision or training.
From an audit perspective, we’ve found in any situation of which we’re aware with our clients, if a firm has stayed up-to-date on the requirements around selling different types of investments – and makes sure everyone involved is aware of their obligations, adheres to the processes, and documents their efforts – then the regulators are generally satisfied. If you fail to make these efforts up front and you’re inconsistent in how you conduct your business from a compliance perspective….you’re just leaving yourself open to trouble.
Reg BI – within the BD community – and I think even though the fiduciary standard has always applied RIA space – we’re going see a whole new layer of extra scrutiny in this regard. The processes that have been central to our platform for years can help support Reg BI requirements and help financial firms and professionals demonstrate the “good faith and reasonable efforts” that Reg BI requires on an ongoing basis. Specifically, we’ve created a comprehensive Reg BI Guide that steps through the Compliance and Care Obligations and correlates the AI Insight support resource to that particular SEC requirement. Again, this is just another way that we help to create efficient and consistent educational and compliance workflows that can help firms at both the product and the firm level.
Q: What is your focus for 2021?
SC: From a business owner’s perspective, ensuring that our team and our product continues to maintain consistent integrity of value and exceptional service; this is the backbone of our business – and making sure that our AI Insight team is challenged and fulfilled in their roles within our company.
From an industry perspective – we believe that there is a tremendous amount of value for advisors to differentiate themselves and bring really great opportunities through the thoughtful and diligent understanding of alternative products. We provide this value by building and bringing together our network of broker-dealers, advisors, RIAs, alternative investment firms and industry partners. Therefore, as in past years, I am always grateful for how far we’ve been able to come and to everyone who has helped us be successful in our efforts to support this industry – and I look forward to working with all of our business partners to explore new possibilities and find what more we can bring to the table for our customers in the new year.
Tuesday, November 3rd, 2020 and is filed under AI Insight News
NASAA’s Reg BI Implementation Committee conducted an examination initiative to evaluate key industry changes as financial firms seek to comply with the SEC’s Regulation Best Interest requirements.
NASAA – Phase 1 National Exam Initiative 2020
NASAA recently published a report on Phase One of this initiative. The top 10 priority areas included:
- Variations in the types of products sold
- Policies, procedures, and practices related to the sale of alternative investments or complex products types
- Cost comparison due diligence and disclosure practices
NASAA’s report states, “[Prior to Reg BI], few firms had policies and procedures governing specific product sales (26%) or used tools to assist agents/representatives and investors in comparing investment opportunities (19%).
|
Top 10 BD Products |
Top 10 IA Products |
| 1. |
Mutual funds (66%) |
Mutual funds (77%) |
| 2. |
Equities (60%) |
Equities (77%) |
| 3. |
Debt/Fixed income (57%) |
Debt/Fixed income (67%) |
| 4. |
Standard ETFs (52%) |
Standard ETFs (67%) |
| 5. |
Municipal funds (50%) |
Listed REITs (39%) |
| 6. |
Variable annuities (49%) |
No-load products (37%) |
| 7. |
Listed REITs (44%) |
Municipal funds (33%) |
| 8. |
Options (44%) |
Options (23%) |
| 9. |
No-load products (38%) |
Variable annuities (15%) |
| 10. |
UITs (37%) |
Leveraged- or inverse-ETFs (15%) |
Chart Source: NASAA Reg BI National Examination Initiative Phase One
Sales of complex products
“NASAA has focused much of its Reg BI examination focus on complex and high-risk products, namely, private securities, variable annuities, non-traded REITs, and leverage- or inverse-ETFs, due to investor confusion and harm emanating from these products.”
| Products |
All firms combined |
BD |
IA |
| Private securities |
7% |
21% |
3% |
| Variable annuities |
14% |
42% |
5% |
| Non-traded REITs |
6% |
18% |
2% |
| Leveraged- or Inverse-ETFs |
9% |
15% |
7% |
Chart Source: NASAA Reg BI National Examination Initiative Phase One
What’s Next?
NASAA will conduct a second examination initiative in 2021 to continue their evaluation of key industry changes.
Resources
Tuesday, October 6th, 2020 and is filed under Industry Reporting
We recently released our September Private Placement Insights report. See the highlights from the report below, or if you are a Premium Reporting subscriber, log in now to see the entire report. If you don’t have access, you can request a free trial.
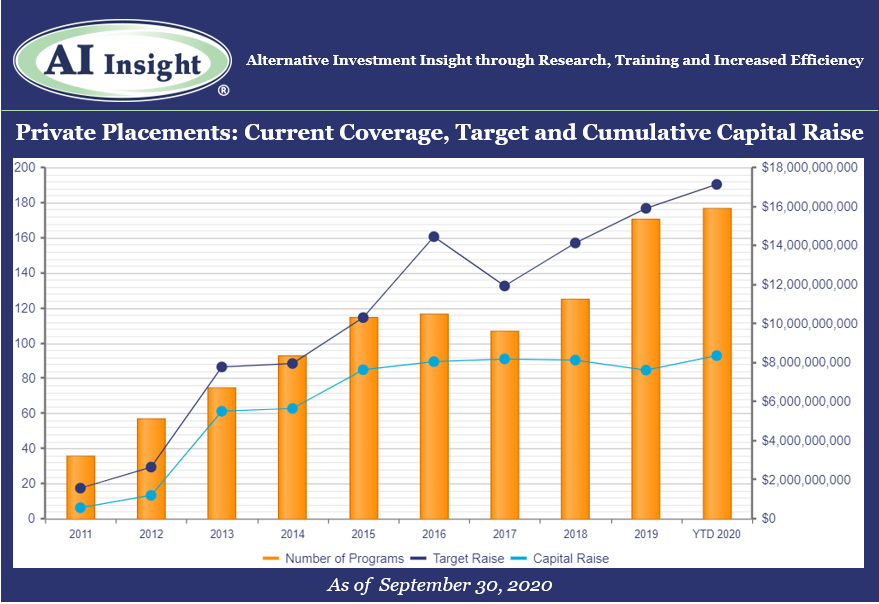
- Private placement fund activity ramped up in September, with more funds added to our coverage in the month than any since March. 19 new funds were added in September, led by 1031s, energy, and non-1031 real estate.
- As of October 1st, AI Insight covers 177 private placements currently raising capital, with an aggregate target raise of $17.1 billion and an aggregate reported raise of $8.4 billion or 49% of target.
- Real estate-related funds, including 1031s, opportunity zones, and non-1031 real estate LLCs and LPs represent the largest component of our private placement coverage, at 72% of funds and 60% of target raise. Private equity/debt funds represent a relatively small amount of our coverage in terms of the number of funds at only 9%, but tend to be larger and represent 27% of aggregate target raise.
- In terms of our coverage by general objective, income is the largest component at 52% of funds, while growth and growth & income follow at 29% and 18%, respectively.
- The average size of the funds currently raising capital is $96.8 million, ranging from $3.5 million for a single asset real estate fund to $2.8 billion for a sector specific private equity/debt fund.
- 76% of private placements we cover use the 506(b) exemption, 15% use 506(c) and 10% have not yet filed their Form D with the SEC.
- 11 private placements closed in September, with all either meeting or exceeding their target raise. 120 funds have closed year-to-date, having been on the market for an average of 333 days and reporting they raised 62% of their target on average.
- Seven private placements suspended offerings and one terminated due to uncertainties related to Covid-19.
- ON DECK: as of October 1st, there were seven new private placements coming soon.
- Listen to the companion podcast for this blog.
Access the full Private Placements report and other hard-to-find alts data
AI Insight’s Industry Reporting capabilities help you review alternative investment trends and historical market data for Private Placements, Non-Traded REITs, Non-Traded BDCs, Interval Funds, and Alternative Strategy Mutual Funds. Receive up to 24 extensive reports per year to help broaden your alternative investment reviews.
Log in or subscribe to AI Insight to further research, sort, compare, and analyze all of the private and public funds in our coverage universe. See who’s new in the industry and what trends are impacting the alts space.
_________________________________
Chart and data as of September 30, 2020, based on programs activated on the AI Insight platform as of this date.
Activated means the program and education module are live on the AI Insight platform. Subscribers can view and download data for the program and access the respective education module.
On a subscription basis, AI Insight provides informational resources and training to financial professionals regarding alternative investment products and offerings. AI Insight is not affiliated with any issuer of such investments or associated in any manner with any offer or sale of such investments. The information above does not constitute an offer to sell any securities or represent an express or implied opinion on or endorsement of any specific alternative investment opportunity, offering or issuer. This report may not be shared, reproduced, duplicated, copied, sold, traded, resold or exploited for any purpose. Copyright ©2020 AI Insight. All Rights Reserved.
Wednesday, September 2nd, 2020 and is filed under Industry Reporting
We recently released our August Private Placement Insights report. See the highlights from the report below, or if you are a Premium Reporting subscriber, log in now to see the entire report. If you don’t have access, you can request a free trial.
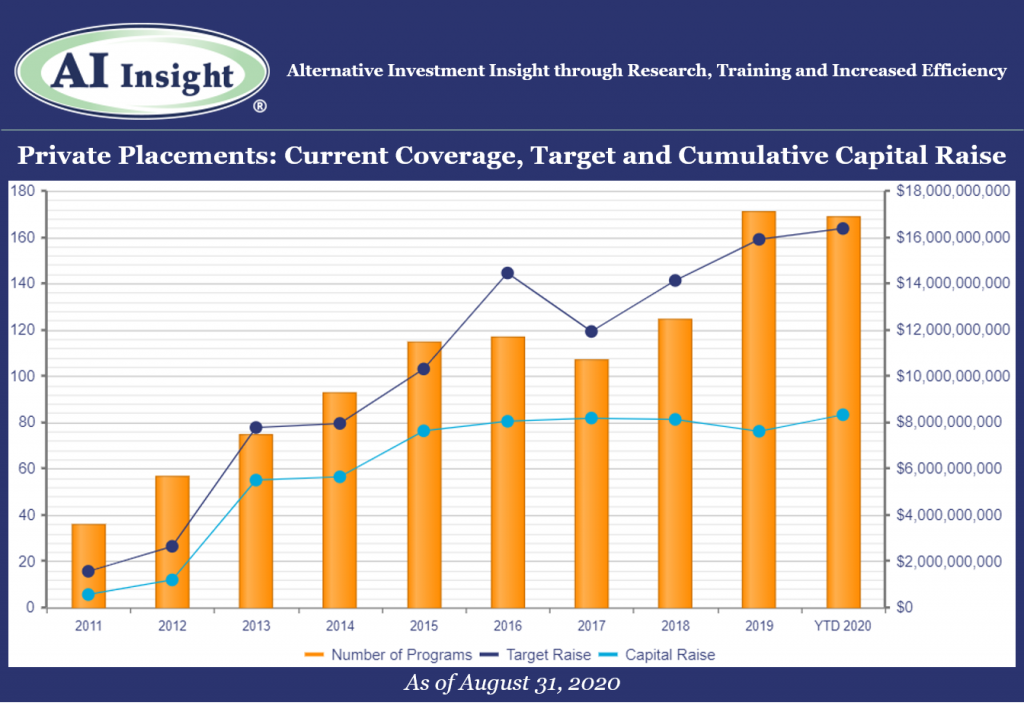
- Private placement fund activity remained steady in August. However, our coverage remains down year-over-year after an anemic spring.
- Thirteen new funds were added to our coverage in August, on par with the last couple of months but well below the 20 or more funds added each month in 2019. Our coverage is down 10.53% in terms of new funds added year-over year, and 28.26% in terms of the aggregate target raise. Fewer funds have been added and they’ve been targeting less capital.
- As of September 1st, AI Insight covers 169 private placements currently raising capital, with an aggregate target raise of $16.4 billion and an aggregate reported raise of $8.3 billion or 51% of target.
- Real estate-related funds, including 1031s, opportunity zones, and non-1031 real estate LLCs and LPs represent the largest component of our private placement coverage, at 73% of funds and 60% of target raise. Private equity/debt funds represent a relatively small amount of our coverage in terms of the number of funds at only 9%, but tend to be larger and represent 28% of aggregate target raise.
- In terms of our coverage by general objective, income is the largest component at 52% of funds, while growth and growth & income follow at 29% and 18%, respectively.
- The average size of the funds currently raising capital is $96.9 million, ranging from $3.5 million for a single asset real estate fund to $2.8 billion for a sector specific private equity/debt fund.
- 76% of private placements we cover use the 506(b) exemption, 15% use 506(c) and 10% have not yet filed their Form D with the SEC.
- 12 private placements closed in August, having raised approximately 57% of their target and having been on the market for an average of 292 days. 109 funds have closed in 2020, having raised 64% of their target. 67% of funds that closed this year met or exceeded their target.
- Five private placements suspended offerings and one terminated due to uncertainties related to Covid-19.
- ON DECK: as of September 1st, there were four new private placements coming soon.
Access the full Private Placements report and other hard-to-find alts data
AI Insight’s Industry Reporting capabilities help you review alternative investment trends and historical market data for Private Placements, Non-Traded REITs, Non-Traded BDCs, Interval Funds, and Alternative Strategy Mutual Funds. Receive up to 24 extensive reports per year to help broaden your alternative investment reviews.
Log in or subscribe to AI Insight to further research, sort, compare, and analyze all of the private and public funds in our coverage universe. See who’s new in the industry and what trends are impacting the alts space.
_________________________________
Chart and data as of August 31, 2020, based on programs activated on the AI Insight platform as of this date.
Activated means the program and education module are live on the AI Insight platform. Subscribers can view and download data for the program and access the respective education module.
On a subscription basis, AI Insight provides informational resources and training to financial professionals regarding alternative investment products and offerings. AI Insight is not affiliated with any issuer of such investments or associated in any manner with any offer or sale of such investments. The information above does not constitute an offer to sell any securities or represent an express or implied opinion on or endorsement of any specific alternative investment opportunity, offering or issuer. This report may not be shared, reproduced, duplicated, copied, sold, traded, resold or exploited for any purpose. Copyright ©2020 AI Insight. All Rights Reserved.
Wednesday, April 8th, 2020 and is filed under Industry Reporting
We recently released our March Private Placement Insights. See the highlights from the report below, or if you are a Premium Reporting subscriber, log in now to see the entire report. If you don’t have access, you can request a free trial.
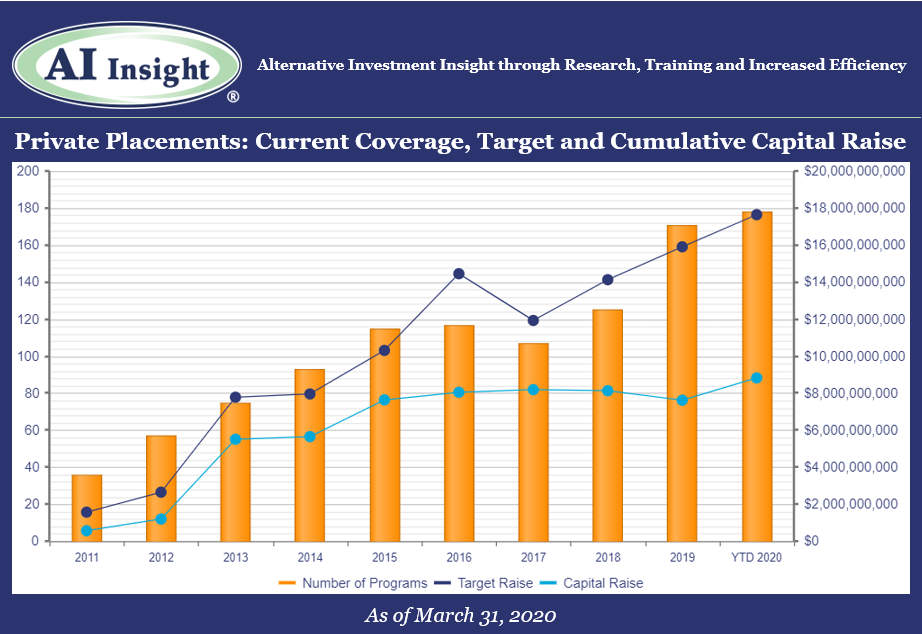
- 15 new private placements were added to our coverage in March, just below the last couple of months but still well over last year’s levels. The industry continues to be led by real estate focused categories including 1031s and real estate LPs and LLCs.
- As of April 1st, AI Insight covers 178 private placements currently raising capital, with an aggregate target raise of $17.6 billion and an aggregate reported raise of $8.8 billion or 50% of target. The average size of the current funds is $99.1 million, ranging from $3.5 million for a single asset real estate fund to $2.5 billion for a sector specific private equity/debt fund.
- 13 private placements closed in March, having raised approximately 70% of their target and having been on the market for an average of 311 days.
- ON DECK: as of April 1st, there were five new private placements coming soon.
Market Update: COVID-19 Impact on Private Placement Markets
On March 11, 2020, the World Health Organization (the WHO) declared the COVID-19 coronavirus a global pandemic. Trade and travel have since grind to a halt with travel restrictions and stay at home orders issued across the globe. The US and global economies are in recession territory, with GDP in the United States now forecast to decline by 0.2% instead of expanding by 2.0% in 2020 as a result of COVID-19. While the full impact of the global pandemic may take years to determine, the one thing we do know is that it will have a significant impact on all aspects of investing both in the public and private markets. Transactions are slowing across the private placement categories and valuations, which require transactions, may be less reliable or difficult to obtain.
Access the full Private Placements report and other hard-to-find alts data
AI Insight’s Industry Reporting capabilities help you review alternative investment trends and historical market data for Private Placements, Non-Traded REITs, BDCs, Closed-End Funds, and Alternative Mutual Funds. Receive up to 24 extensive reports per year to help broaden your alternative investment reviews.
Log in or subscribe to AI Insight to further research, sort, compare, and analyze all of the private and public funds in our coverage universe. See who’s new in the industry and what trends are impacting the alts space.
_________________________________
Chart and data as of March 31, 2020, based on programs activated on the AI Insight platform as of this date.
Activated means the program and education module are live on the AI Insight platform. Subscribers can view and download data for the program and access the respective education module.
On a subscription basis, AI Insight provides informational resources and training to financial professionals regarding alternative investment products and offerings. AI Insight is not affiliated with any issuer of such investments or associated in any manner with any offer or sale of such investments. The information above does not constitute an offer to sell any securities or represent an express or implied opinion on or endorsement of any specific alternative investment opportunity, offering or issuer. This report may not be shared, reproduced, duplicated, copied, sold, traded, resold or exploited for any purpose. Copyright ©2020 AI Insight. All Rights Reserved.
Thursday, March 12th, 2020 and is filed under Industry Reporting
AI Insight currently covers 72 1031 exchange programs and 58 non-1031 real estate private placements. In our February 2020 Private Placement Industry Report, it shows that both categories are growing again in 2020, with 1031s continuing their record growth from the last couple of years.
We wanted to look at fees within both categories, from a current standpoint – what do fees look like now, and from a historical standpoint – have up-front selling commissions declined and have net proceeds increased?
Current Fees
To look at current fees, we utilized our Fee and Expense Report which compares fees on similar programs within our coverage universe. This report updates as programs close and new coverage is added. Below is a snapshot of programs raising capital as of March 9, 2020.
1031 Exchanges
- Up-front selling commission
- Industry Range: 5 – 6.55%
- Industry Average: 5.76%
- Net Proceeds (Before Acquisition Fees)
- Industry Range: 84.78 – 92.50%
- Industry Average: 90.11%
- Acquisition Fees and Expenses
- Industry Range: 0.16 – 13.25%
- Industry Average: 4.29%
- Liquidation Fees
- Industry Range: 1 – 8.50%
- Industry Average: 3.08%
Non-1031 Real Estate LPs and LLCs:
- Up-front selling commission
- Industry Range: 0 – 8%
- Industry Average: 5.49%
- Net Proceeds (Before Acquisition Fees)
- Industry Range: 86.50 – 98%
- Industry Average: 90.32%
- Acquisition Fees and Expenses
- Industry Range: 0 – 19%
- Industry Average: 2.74%
- Liquidation Fees
- Industry Range: 0 – 40%
- Industry Average: 7.98%
Historical Fees – Up-front Selling Commissions
Fees have always been a focus of regulatory concern, although up-front selling commissions have been at the forefront of regulatory scrutiny over the last decade. FINRA Regulatory Notice 15-02 required greater transparency into pricing including fees for direct participation programs and non-traded REITs. The DOL’s previously proposed Fiduciary Rule and now Regulation Best Interest, require financial professionals to carefully review and disclose the material fees and costs related to a client’s holdings.
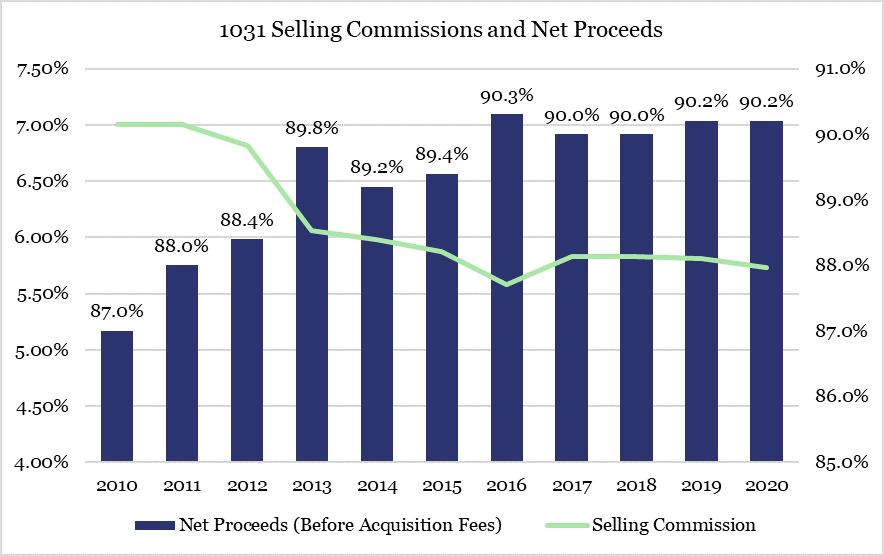
With this in mind, we reviewed the data on our platform for the real estate private placements we covered over the last decade to see if there has been any change in the average up-front selling commissions and the average net proceeds (before acquisition fees, which includes up-front fees and expenses taken from offering proceeds) for these programs.
We found that up-front selling commissions have declined and net proceeds before acquisition fees has increased for 1031 exchanges and non-1031 real estate private placements over the last decade.
1031 selling commissions went from an average of 7% in 2010 to 5.73% for programs that opened in 2020, while the average net proceeds increased from 87 to 90.2%. This is a difference of approximately $3,200 on a $100,000 investment.
Results are similar for non-1031 real estate LPs and LLCs, with selling commissions declining from an average of 6.94% in 2010 to 6% in 2020. Net proceeds are up from 87.61% in 2010 to 89.30% in 2020 for a difference of $2,390 per $100,000 investment.
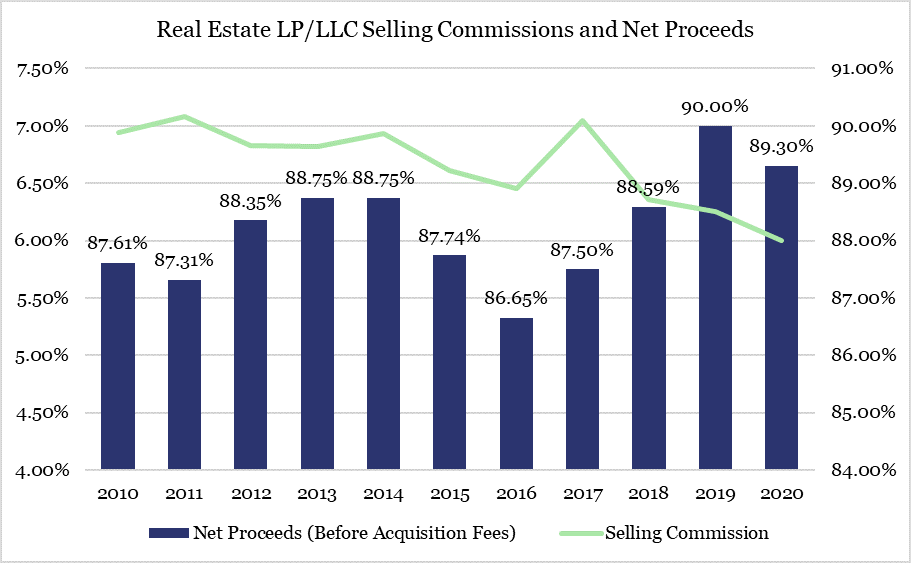
When looking at fees over time for real estate private placements, it appears the industry has responded to regulatory focus over the last decade by reducing up-front fees and expenses; even for private placements that may not be applicable to FINRA Regulatory Notice 15-02. However, real estate by its very nature can be an expensive asset class.
It is important to remember that although it may be good to see up-front fees decline, there are many other fees and expenses related to owning and operating direct real estate that must be considered reasonable including, but not limited to, construction costs, acquisition-related expenses, financing costs, leasing commissions, insurance and legal costs, and property management fees.
Wednesday, February 12th, 2020 and is filed under AI Insight News
FINRA recently issued its 2020 Risk Monitoring and Examination Priorities Letter along with its 2019 Report on Examination Findings and Observations. As expected, Regulation Best Interest (Reg BI) takes the lead in this discussion. These reports also highlight, among other things, the continued focus on sales practices regarding supervision and client suitability.
Specifically, the 2020 Priorities Letter states,
“In the first part of the year, FINRA will review firms’ preparedness for Reg BI to gain an understanding of implementation challenges they face and, after the compliance date, will examine firms’ compliance with Reg BI, Form CRS and related SEC guidance and interpretations. FINRA staff expects to work with SEC staff to ensure consistency in examining broker-dealers and their associated persons for compliance with Reg BI and Form CRS.”
The 2019 Findings Report stated,
“Some firms did not have adequate systems of supervision to review that recommendations were suitable in light of a customer’s individual financial situation and needs, investment experience, risk tolerance, time horizon, investment objectives, liquidity needs and other investment profile factors. This report shares some new suitability-related findings, as well as additional nuances on prior years’ findings.”
Cybersecurity
At the end of the letter, FINRA addresses firm operations, technology and cybersecurity noting, “FINRA recognizes that there is no one-size-fits-all approach to cybersecurity, but expects firms to implement controls appropriate to their business model and scale of operations.”
Key Takeaways
- See this checklist, which explains key differences between FINRA rules and Reg BI and Form CRS.
- Carefully review and understand the specific suitability requirements for each non-traded or private placement program utilized and ensure that your firm has a documented process in place to monitor the compliance with suitability requirements.
- Document the due diligence process – remember, if it isn’t documented, it was never done.
- Review how regulators look at cybersecurity and key strategies to be compliant. Click here for additional resources and take the CE Course, “Cybersecurity Awareness for Financial Professionals”.
Let AI Insight help you stay compliant
- Discover how you can create efficiencies in your due diligence review process using our database of 350+ alternative investments to source new products as well as analyze and compare hundreds of alternative investment programs, including non-traded programs, private placements, and alternative mutual funds.
- Demonstrate your due diligence by conducing product-specific training on the features, risks and suitability for hundreds of offerings.
- Document what you’re doing to support your firm’s regulatory requirements in a transparent way. AI Insight captures all of the activity you and your firm members complete within the platform including training modules, offering document reviews and research conducted.
Resources
Tuesday, June 12th, 2018 and is filed under AI Insight News
It was great to connect with many of our industry partners at the recent FINRA Annual Conference in Washington, D.C. to discuss regulatory topics relevant to our industry. Here are three key takeaways to consider:
- The industry continues moving forward with a new approach to the standard of care registered representatives must undertake when working with clients. SEC Chairman Clayton was adamant about having industry stakeholders submit comments to help shape the actual outcome of the proposal. He was also quite vocal on the confusion people seem to have around the term “fiduciary” and that he was very much against using it in this proposal. The SEC’s Brett Redfearn provided an overview of Regulation Best Interest and enhancing the standard of conduct for broker-dealers. Read more
- On a suitability panel, “inadequate training relative to products and risks” was noted by FINRA as a common weakness found.
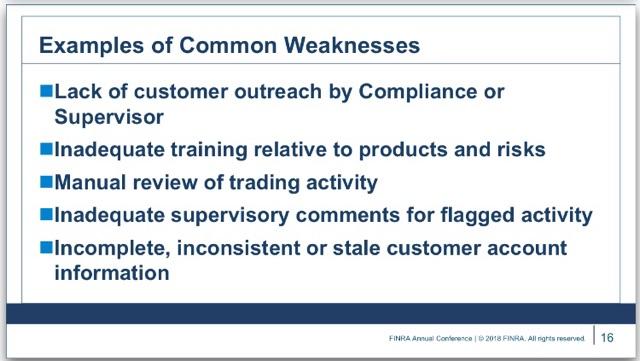
- Heightened diligence and advisor education are needed for the increasingly complex products being offered through traditional ’40 Act structures such as Alternative Mutual Funds and Interval Funds. FINRA mentioned their guidance on complex products as a resource when working with Alternative Mutual Funds, leveraged ETFs, Interval Funds and other alternative investments.