Tuesday, November 10th, 2020 and is filed under Industry Reporting
We recently released our October Private Placement Insights report. See the highlights from the report below, or if you are a Premium Reporting subscriber, log in now to see the entire report. If you don’t have access, you can request a free trial.
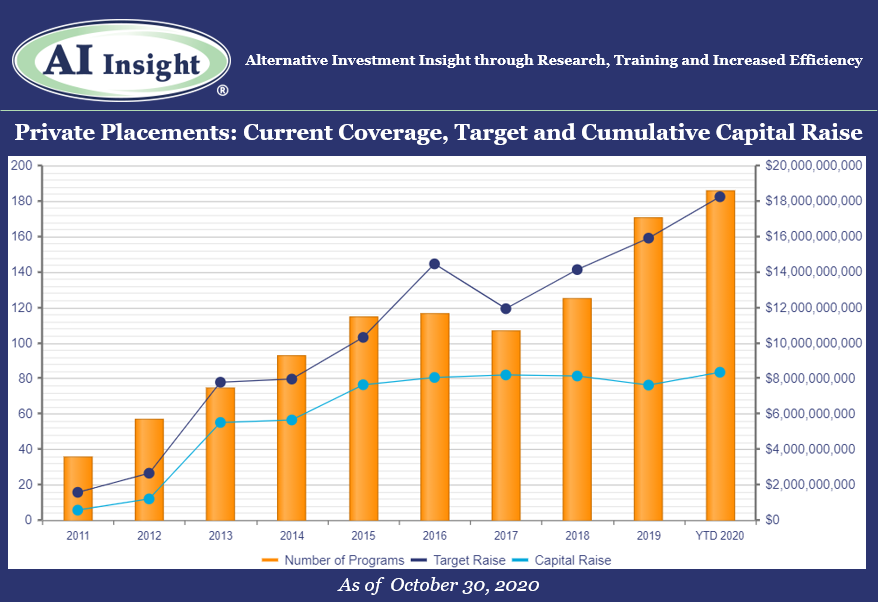
- Private placement fund activity continued its strong pace in October, with more funds added to our coverage in the month than any since March. 26 new funds were added in October, led primarily by real estate funds but also including energy, private equity/debt, and preferred offerings.
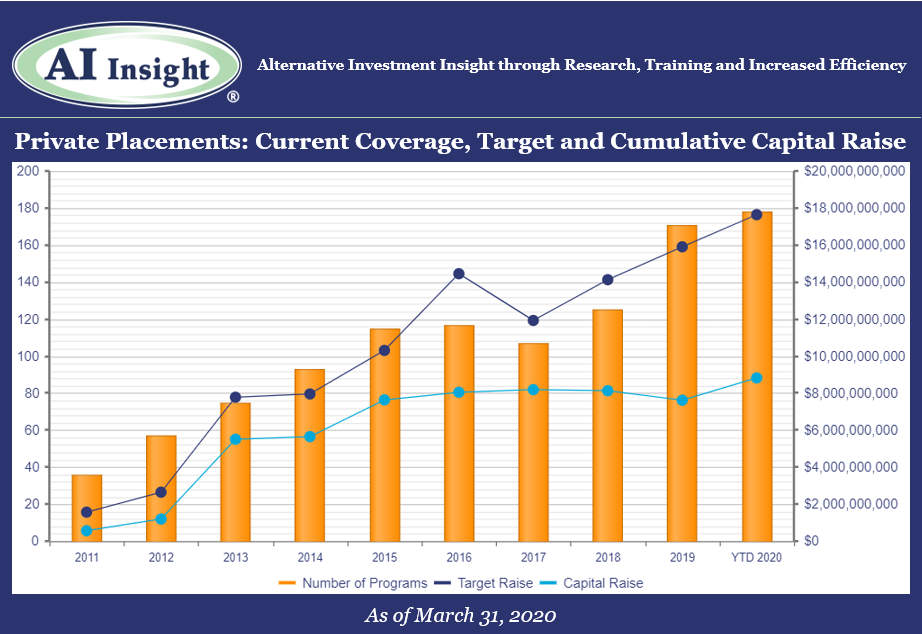
- As of November 1st, AI Insight covers 186 private placements currently raising capital, with an aggregate target raise of $18.2 billion and an aggregate reported raise of $8.34 billion or 46% of target.
- Real estate-related funds, including 1031s, opportunity zones, and non-1031 real estate LLCs and LPs represent the largest component of our private placement coverage, at 72% of funds and 59% of target raise. Private equity/debt funds represent a relatively small amount of our coverage in terms of the number of funds at only 10%, but tend to be larger and represent 29% of aggregate target raise.
- In terms of our coverage by general objective, income is the largest component at 52% of funds, while growth and growth & income follow at 28% and 19%, respectively.
- The average size of the funds currently raising capital is $98.0 million, ranging from $3.5 million for a single asset real estate fund to $2.8 billion for a sector specific private equity/debt fund.
- 74% of private placements we cover use the 506(b) exemption, 13% use 506(c) and 13% have not yet filed their Form D with the SEC.
- 18 private placements closed in October, with roughly 70% meeting or exceeding their target raise. 137 funds have closed year-to-date, having been on the market for an average of 339 days and reporting they raised 68% of their target on average. 72% met or exceeded targets, and only 16% were able to raise less than half of their target.
- Seven private placements suspended offerings and one terminated due to uncertainties related to COVID-19.
- ON DECK: as of November 1st, there were seven new private placements coming soon.
Access the full Private Placements report and other hard-to-find alts data
AI Insight’s Industry Reporting capabilities help you review alternative investment trends and historical market data for Private Placements, Non-Traded REITs, Non-Traded BDCs, Interval Funds, and Alternative Strategy Mutual Funds. Receive up to 24 extensive reports per year to help broaden your alternative investment reviews.
Log in or subscribe to AI Insight to further research, sort, compare, and analyze all of the private and public funds in our coverage universe. See who’s new in the industry and what trends are impacting the alts space.
_________________________________
Chart and data as of October 31, 2020, based on programs activated on the AI Insight platform as of this date.
Activated means the program and education module are live on the AI Insight platform. Subscribers can view and download data for the program and access the respective education module.
On a subscription basis, AI Insight provides informational resources and training to financial professionals regarding alternative investment products and offerings. AI Insight is not affiliated with any issuer of such investments or associated in any manner with any offer or sale of such investments. The information above does not constitute an offer to sell any securities or represent an express or implied opinion on or endorsement of any specific alternative investment opportunity, offering or issuer. This report may not be shared, reproduced, duplicated, copied, sold, traded, resold or exploited for any purpose. Copyright ©2020 AI Insight. All Rights Reserved.
Tuesday, October 6th, 2020 and is filed under Industry Reporting
We recently released our September Private Placement Insights report. See the highlights from the report below, or if you are a Premium Reporting subscriber, log in now to see the entire report. If you don’t have access, you can request a free trial.
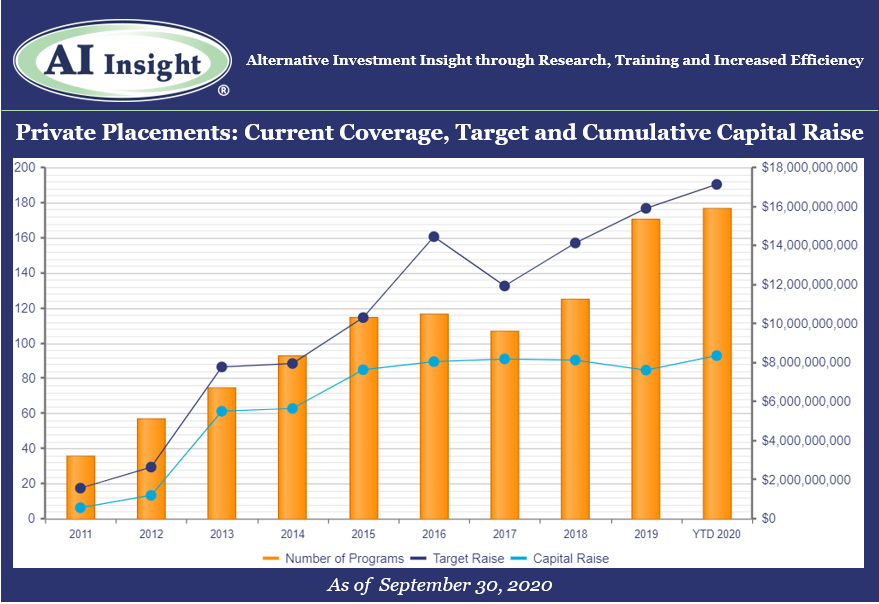
- Private placement fund activity ramped up in September, with more funds added to our coverage in the month than any since March. 19 new funds were added in September, led by 1031s, energy, and non-1031 real estate.
- As of October 1st, AI Insight covers 177 private placements currently raising capital, with an aggregate target raise of $17.1 billion and an aggregate reported raise of $8.4 billion or 49% of target.
- Real estate-related funds, including 1031s, opportunity zones, and non-1031 real estate LLCs and LPs represent the largest component of our private placement coverage, at 72% of funds and 60% of target raise. Private equity/debt funds represent a relatively small amount of our coverage in terms of the number of funds at only 9%, but tend to be larger and represent 27% of aggregate target raise.
- In terms of our coverage by general objective, income is the largest component at 52% of funds, while growth and growth & income follow at 29% and 18%, respectively.
- The average size of the funds currently raising capital is $96.8 million, ranging from $3.5 million for a single asset real estate fund to $2.8 billion for a sector specific private equity/debt fund.
- 76% of private placements we cover use the 506(b) exemption, 15% use 506(c) and 10% have not yet filed their Form D with the SEC.
- 11 private placements closed in September, with all either meeting or exceeding their target raise. 120 funds have closed year-to-date, having been on the market for an average of 333 days and reporting they raised 62% of their target on average.
- Seven private placements suspended offerings and one terminated due to uncertainties related to Covid-19.
- ON DECK: as of October 1st, there were seven new private placements coming soon.
- Listen to the companion podcast for this blog.
Access the full Private Placements report and other hard-to-find alts data
AI Insight’s Industry Reporting capabilities help you review alternative investment trends and historical market data for Private Placements, Non-Traded REITs, Non-Traded BDCs, Interval Funds, and Alternative Strategy Mutual Funds. Receive up to 24 extensive reports per year to help broaden your alternative investment reviews.
Log in or subscribe to AI Insight to further research, sort, compare, and analyze all of the private and public funds in our coverage universe. See who’s new in the industry and what trends are impacting the alts space.
_________________________________
Chart and data as of September 30, 2020, based on programs activated on the AI Insight platform as of this date.
Activated means the program and education module are live on the AI Insight platform. Subscribers can view and download data for the program and access the respective education module.
On a subscription basis, AI Insight provides informational resources and training to financial professionals regarding alternative investment products and offerings. AI Insight is not affiliated with any issuer of such investments or associated in any manner with any offer or sale of such investments. The information above does not constitute an offer to sell any securities or represent an express or implied opinion on or endorsement of any specific alternative investment opportunity, offering or issuer. This report may not be shared, reproduced, duplicated, copied, sold, traded, resold or exploited for any purpose. Copyright ©2020 AI Insight. All Rights Reserved.
Wednesday, September 2nd, 2020 and is filed under Industry Reporting
We recently released our August Private Placement Insights report. See the highlights from the report below, or if you are a Premium Reporting subscriber, log in now to see the entire report. If you don’t have access, you can request a free trial.
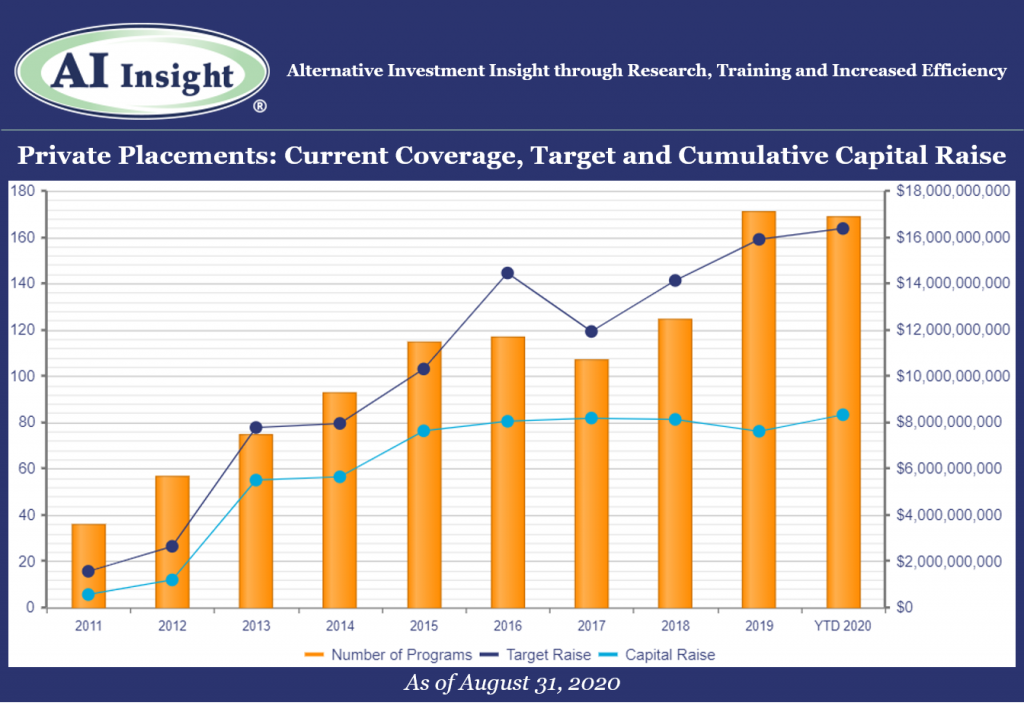
- Private placement fund activity remained steady in August. However, our coverage remains down year-over-year after an anemic spring.
- Thirteen new funds were added to our coverage in August, on par with the last couple of months but well below the 20 or more funds added each month in 2019. Our coverage is down 10.53% in terms of new funds added year-over year, and 28.26% in terms of the aggregate target raise. Fewer funds have been added and they’ve been targeting less capital.
- As of September 1st, AI Insight covers 169 private placements currently raising capital, with an aggregate target raise of $16.4 billion and an aggregate reported raise of $8.3 billion or 51% of target.
- Real estate-related funds, including 1031s, opportunity zones, and non-1031 real estate LLCs and LPs represent the largest component of our private placement coverage, at 73% of funds and 60% of target raise. Private equity/debt funds represent a relatively small amount of our coverage in terms of the number of funds at only 9%, but tend to be larger and represent 28% of aggregate target raise.
- In terms of our coverage by general objective, income is the largest component at 52% of funds, while growth and growth & income follow at 29% and 18%, respectively.
- The average size of the funds currently raising capital is $96.9 million, ranging from $3.5 million for a single asset real estate fund to $2.8 billion for a sector specific private equity/debt fund.
- 76% of private placements we cover use the 506(b) exemption, 15% use 506(c) and 10% have not yet filed their Form D with the SEC.
- 12 private placements closed in August, having raised approximately 57% of their target and having been on the market for an average of 292 days. 109 funds have closed in 2020, having raised 64% of their target. 67% of funds that closed this year met or exceeded their target.
- Five private placements suspended offerings and one terminated due to uncertainties related to Covid-19.
- ON DECK: as of September 1st, there were four new private placements coming soon.
Access the full Private Placements report and other hard-to-find alts data
AI Insight’s Industry Reporting capabilities help you review alternative investment trends and historical market data for Private Placements, Non-Traded REITs, Non-Traded BDCs, Interval Funds, and Alternative Strategy Mutual Funds. Receive up to 24 extensive reports per year to help broaden your alternative investment reviews.
Log in or subscribe to AI Insight to further research, sort, compare, and analyze all of the private and public funds in our coverage universe. See who’s new in the industry and what trends are impacting the alts space.
_________________________________
Chart and data as of August 31, 2020, based on programs activated on the AI Insight platform as of this date.
Activated means the program and education module are live on the AI Insight platform. Subscribers can view and download data for the program and access the respective education module.
On a subscription basis, AI Insight provides informational resources and training to financial professionals regarding alternative investment products and offerings. AI Insight is not affiliated with any issuer of such investments or associated in any manner with any offer or sale of such investments. The information above does not constitute an offer to sell any securities or represent an express or implied opinion on or endorsement of any specific alternative investment opportunity, offering or issuer. This report may not be shared, reproduced, duplicated, copied, sold, traded, resold or exploited for any purpose. Copyright ©2020 AI Insight. All Rights Reserved.
Monday, July 6th, 2020 and is filed under Industry Reporting
We recently released our June Private Placement Insights report. See the highlights from the report below, or if you are a Premium Reporting subscriber, log in now to see the entire report. If you don’t have access, you can request a free trial.
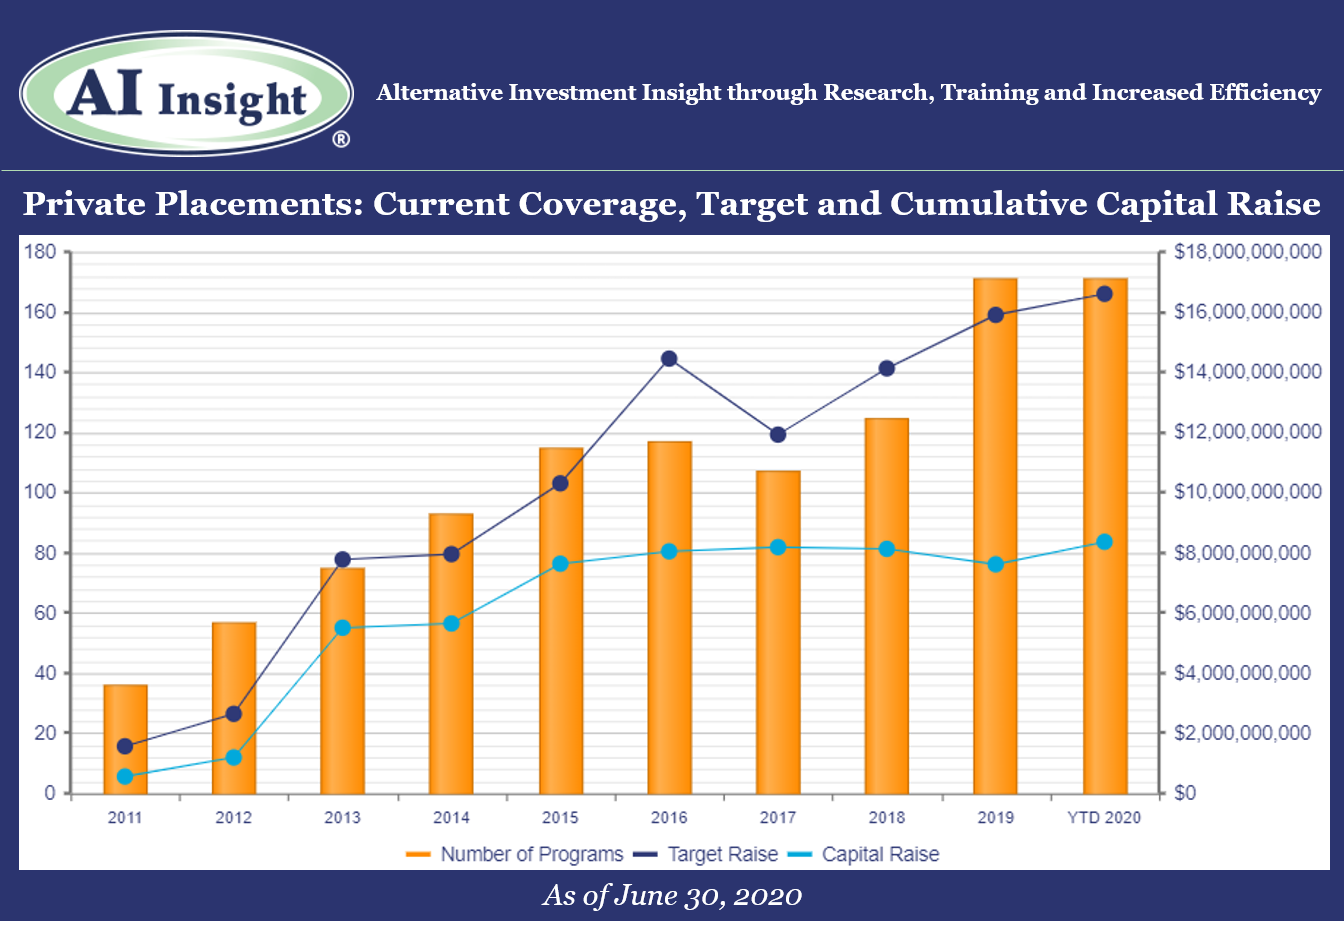
- After a slow couple of months, private placement fund formation accelerated in June, led by stronger activity in 1031s and the addition of distressed funds in the wake of the COVID-19 market disruption.
- As of July 1st, AI Insight covers 171 private placements currently raising capital, with an aggregate target raise of $16.6 billion and an aggregate reported raise of $8.4 billion or 51% of target. The average size of the current funds is $97.1 million, ranging from $3.5 million for a single asset real estate fund to $2.7 billion for a sector specific private equity/debt fund.
- 13 private placements closed in June, having raised approximately 65% of their target and having been on the market for an average of 408 days. 88 funds have closed in 2020, having raised 67% of their target.
- Five private placements suspended offerings and one terminated due to uncertainties related to COVID-19.
- ON DECK: as of July 1st, there were three new private placements coming soon, all opportunity zone funds (QOZs) as the category ramps back up with further regulatory guidance.
Access the full Private Placements report and other hard-to-find alts data
AI Insight’s Industry Reporting capabilities help you review alternative investment trends and historical market data for Private Placements, Non-Traded REITs, BDCs, Interval Funds, and Alternative Mutual Funds. Receive up to 24 extensive reports per year to help broaden your alternative investment reviews.
Log in or subscribe to AI Insight to further research, sort, compare, and analyze all of the private and public funds in our coverage universe. See who’s new in the industry and what trends are impacting the alts space.
_________________________________
Chart and data as of June 30, 2020, based on programs activated on the AI Insight platform as of this date.
Activated means the program and education module are live on the AI Insight platform. Subscribers can view and download data for the program and access the respective education module.
On a subscription basis, AI Insight provides informational resources and training to financial professionals regarding alternative investment products and offerings. AI Insight is not affiliated with any issuer of such investments or associated in any manner with any offer or sale of such investments. The information above does not constitute an offer to sell any securities or represent an express or implied opinion on or endorsement of any specific alternative investment opportunity, offering or issuer. This report may not be shared, reproduced, duplicated, copied, sold, traded, resold or exploited for any purpose. Copyright ©2020 AI Insight. All Rights Reserved.
Monday, June 8th, 2020 and is filed under Industry Reporting
We recently released our May Private Placement Insights report. See the highlights from the report below, or if you are a Premium Reporting subscriber, log in now to see the entire report. If you don’t have access, you can request a free trial.
- Private placement fund formation has slowed in the wake of COVID-19. Eight new private placements were added to our coverage in May, roughly half of the monthly level we’ve seen on average over the last few years. The first few months of 2020 were strong but with the slowdown in May, we are now flat in terms of new funds added to over coverage year-over-year and down modestly in aggregate target raise.
- The slowdown was most visible in the 1031 category, where only four new funds were added to our coverage in May compared to well over double digit additions for the last several years. This may be partially due to a slowdown in real estate transactions overall as well as a lack of confidence in valuations. Also, fewer highly appreciated properties are being sold right now, which reduces the demand for 1031 exchanges at least in the near-term. The consensus in the industry is that demand will accelerate once transaction activity resumes and valuations are more reliable.
- We are seeing more activity this year in preferred securities and private equity/debt funds, and we are also starting to see sector-specific opportunistic funds ramp up in the wake of the COVID-19 market disruption. Opportunity zone (QOZ) funds, which had paused for several months, are back on track with three in the queue to be added to our coverage soon. Recent events around the US could continue to highlight the importance of QOZ strategies.
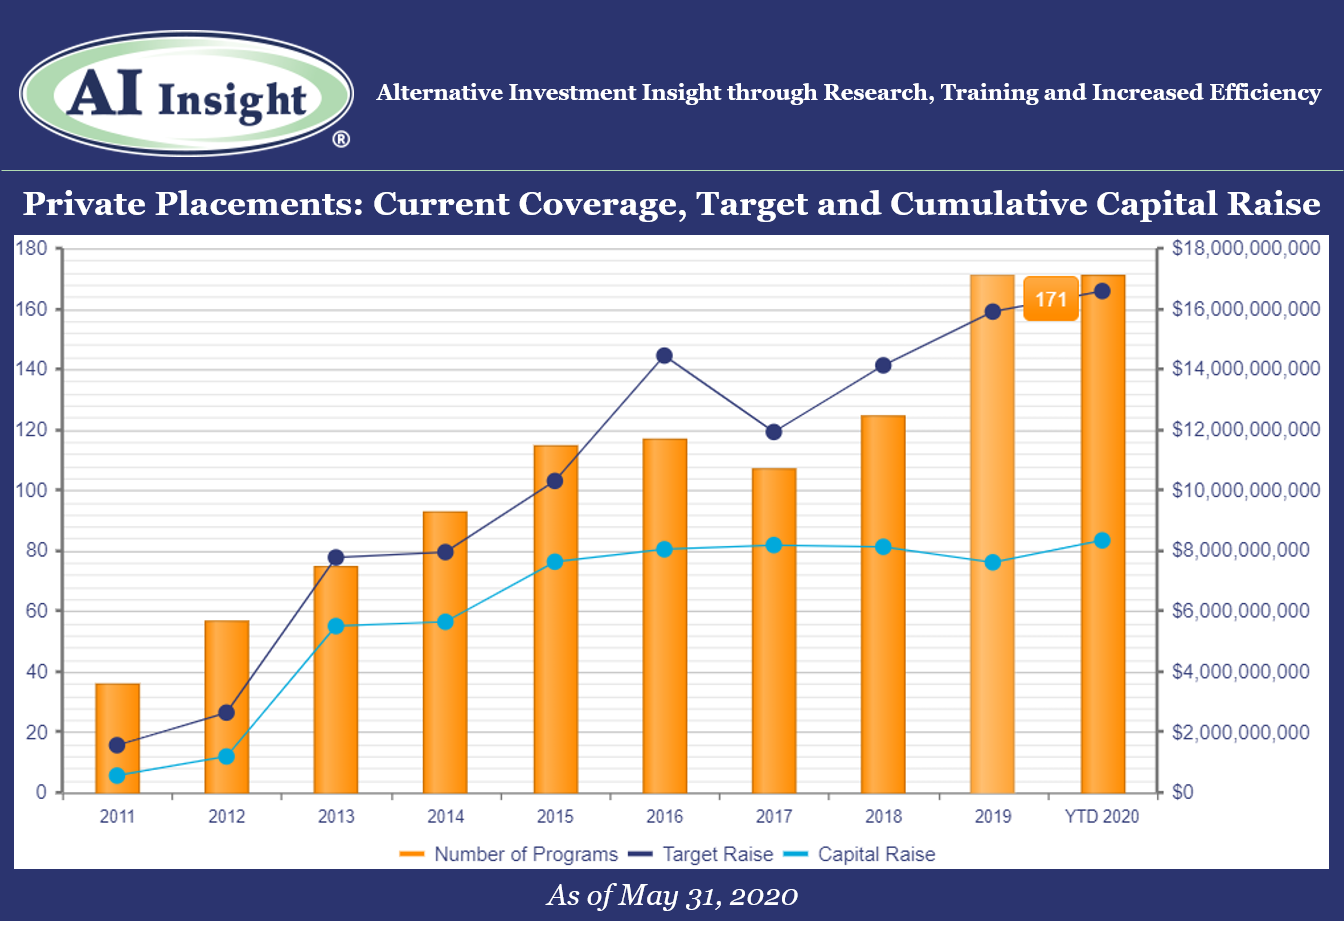
- As of June 1st, AI Insight covers 171 private placements currently raising capital, with an aggregate target raise of $16.6 billion and an aggregate reported raise of $8.3 billion or 50% of target. The average size of the current funds is $97.0 million, ranging from $3.5 million for a single asset real estate fund to $2.7 billion for a sector specific private equity/debt fund.
- 14 private placements closed in May, having raised approximately 52% of their target and having been on the market for an average of 336 days.
- Five private placements suspended offerings due to uncertainties related to COVID-19.
- ON DECK: as of June 1st, there were four new private placements coming soon.
Access the full Private Placements report and other hard-to-find alts data
AI Insight’s Industry Reporting capabilities help you review alternative investment trends and historical market data for Private Placements, Non-Traded REITs, BDCs, Closed-End Funds, and Alternative Mutual Funds. Receive up to 24 extensive reports per year to help broaden your alternative investment reviews.
Log in or subscribe to AI Insight to further research, sort, compare, and analyze all of the private and public funds in our coverage universe. See who’s new in the industry and what trends are impacting the alts space.
_________________________________
Chart and data as of May 31, 2020, based on programs activated on the AI Insight platform as of this date.
Activated means the program and education module are live on the AI Insight platform. Subscribers can view and download data for the program and access the respective education module.
On a subscription basis, AI Insight provides informational resources and training to financial professionals regarding alternative investment products and offerings. AI Insight is not affiliated with any issuer of such investments or associated in any manner with any offer or sale of such investments. The information above does not constitute an offer to sell any securities or represent an express or implied opinion on or endorsement of any specific alternative investment opportunity, offering or issuer. This report may not be shared, reproduced, duplicated, copied, sold, traded, resold or exploited for any purpose. Copyright ©2020 AI Insight. All Rights Reserved.
Thursday, May 7th, 2020 and is filed under Industry Reporting
We recently released our April Private Placement Insights. See the highlights from the report below, or if you are a Premium Reporting subscriber, log in now to see the entire report. If you don’t have access, you can request a free trial.
- 10 new private placements were added to our coverage in April, ahead of last year’s levels on a YTD basis but below the last couple of months. The industry is still led by real estate funds including 1031s and real estate LPs and LLCs, although 1031s have slowed significantly.
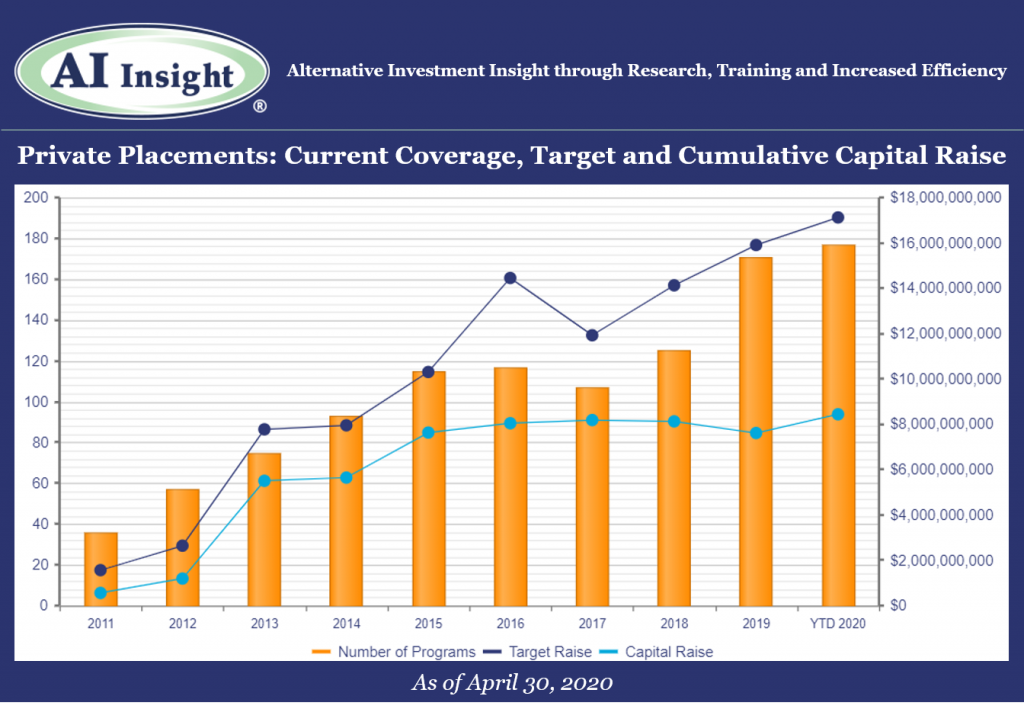
- As of May 1st, AI Insight covers 177 private placements currently raising capital, with an aggregate target raise of $17.1 billion and an aggregate reported raise of $8.4 billion or 49% of target. The average size of the current funds is $96.7 million, ranging from $3.5 million for a single asset real estate fund to $2.5 billion for a sector specific private equity/debt fund.
- 12 private placements closed in April, having raised approximately 63% of their target and having been on the market for an average of 422 days. Two private placements suspended offerings due to uncertainties related to COVID-19.
- ON DECK: as of May 1st, there were three new private placements coming soon.
Private Market Update: COVID-19
- According to a recent report by Preqin, COVID-19 has disrupted the private capital markets significantly across all categories.
- Fewer private equity funds met their target fundraising goals and were able to close in Q1 versus prior quarters. Many had established high fundraising targets prior to COVID-19.
- Private equity fundraising was actually up year-over-year, with the largest and most established funds securing the majority of capital raised.
- Fewer private equity transactions were completed as managers held off on M&A activity anticipating that asset prices would fall in a recession.
- The level of dry powder in the private equity industry is at a record $1.4 trillion as of April 2020. Additionally, 2019 vintage funds, which were originally projected to underperform prior vintages, are now more likely to outperform given the drop in asset prices.
- Private debt fundraising declined in Q1. Direct lending and special situations funds accounted for the majority of fundraising within the category.
- Private real estate fundraising fell in Q1 2020. Managers raised $81 billion from 51 funds versus $51 billion from 83 funds in Q1 2019.
- Private real estate transactions also declined year-over-year, with 1,797 deals completed in Q1 2020 compared to 2,417 deals in Q1 2019.
- Within the real assets category, infrastructure and natural resource fundraising actually increased, and the volume of infrastructure transactions was in line with the prior year. Energy slowed significantly, while social infrastructure sectors such as telecom actually saw increases in fundraising and deal activity.
- Hedge fund launches have stalled from prior months, especially in the equity strategy sector. This makes sense given the recent downturn, although most hedge fund categories performed as expected. The Preqin All Strategies Hedge Fund benchmark declined 10.38% in Q1 2020, compared to the 20% loss in the S&P 500 Index.
Access the full Private Placements report and other hard-to-find alts data
AI Insight’s Industry Reporting capabilities help you review alternative investment trends and historical market data for Private Placements, Non-Traded REITs, BDCs, Closed-End Funds, and Alternative Mutual Funds. Receive up to 24 extensive reports per year to help broaden your alternative investment reviews.
Log in or subscribe to AI Insight to further research, sort, compare, and analyze all of the private and public funds in our coverage universe. See who’s new in the industry and what trends are impacting the alts space.
_________________________________
Chart and data as of April 30, 2020, based on programs activated on the AI Insight platform as of this date.
Activated means the program and education module are live on the AI Insight platform. Subscribers can view and download data for the program and access the respective education module.
On a subscription basis, AI Insight provides informational resources and training to financial professionals regarding alternative investment products and offerings. AI Insight is not affiliated with any issuer of such investments or associated in any manner with any offer or sale of such investments. The information above does not constitute an offer to sell any securities or represent an express or implied opinion on or endorsement of any specific alternative investment opportunity, offering or issuer. This report may not be shared, reproduced, duplicated, copied, sold, traded, resold or exploited for any purpose. Copyright ©2020 AI Insight. All Rights Reserved.
Wednesday, April 29th, 2020 and is filed under Alternative Strategy Mutual Funds
Introduction
As the dust settles from the Corona Market, albeit perhaps temporarily, it is prudent to revisit one’s portfolio and assess the effectiveness of your asset allocation. Diversification is an important component to risk management, and at no time is this better tested than during an equity selloff. Beyond the traditional stock and bond allocation, alternative investments can be an effective way to accomplish this. Broadly speaking, the asset class is designed to provide alternative sources of return to traditional market beta and provide the potential for capital preservation during market drawdowns. As such, it is good to assess the performance of alternatives during these periods to see if the hypothesis holds. Specifically, this piece will focus on alternative mutual fund (AMF) performance through the 1st quarter of 2020. AMFs offer exposure to “hedge fund-like” strategies among other non-traditional approaches within a mutual fund structure. Thus, they can be a liquid and cost-effective means to enhance portfolio diversification.
For the scope of this piece we will define the Corona Market as the equity declines experienced from February 19th through March 23rd. As much uncertainty around the COVID-19 virus and its economic impacts remain, it is important to understand that volatility may persist and that a new low may be established before the drawdown is officially measured. Working with this definition of the Corona Market allows us to make some unique observations about the recent market drawdown.
The Corona Market
The total loss to the S&P 500 Index, a barometer for US equity markets, amounted to 33.8%. According to data from the CFRA, the average loss experienced during all bear markets dating back to 1929 is 38.2%. Thus, from a historical perspective, the Corona Market was below average in magnitude. However, what made the drawdown so extreme was the speed in which it took place.
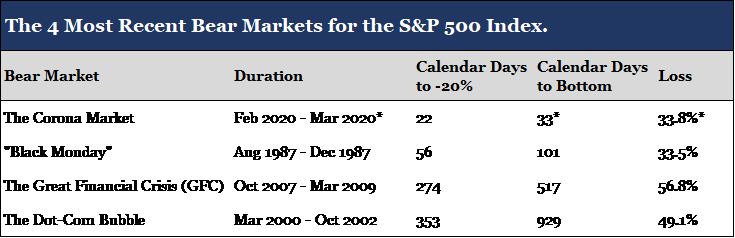
*Assumes that the March 23rd index low is the bottom of the Corona Market. Data for the table was sourced from CFRA and S&P Down Jones Indices.
As demonstrated by the table above, the Corona Market decline reached 20% (the definition of a bear market) in 22 calendar days. This is less than half the time it took markets to reach bear territory in 1987 (“Black Monday”) and far below the average of 254 calendar days dating back to 1929. The Corona Market also reached its current low in just 33 days. Such extreme price volatility highlights the uniqueness of a pandemic induced selloff. Taking a closer look, the following chart represents daily NAV changes in excess of +/- 2.5% for the iShares Core S&P 500 ETF (IVV), a passive ETF that tracks the returns of the S&P 500 Index.
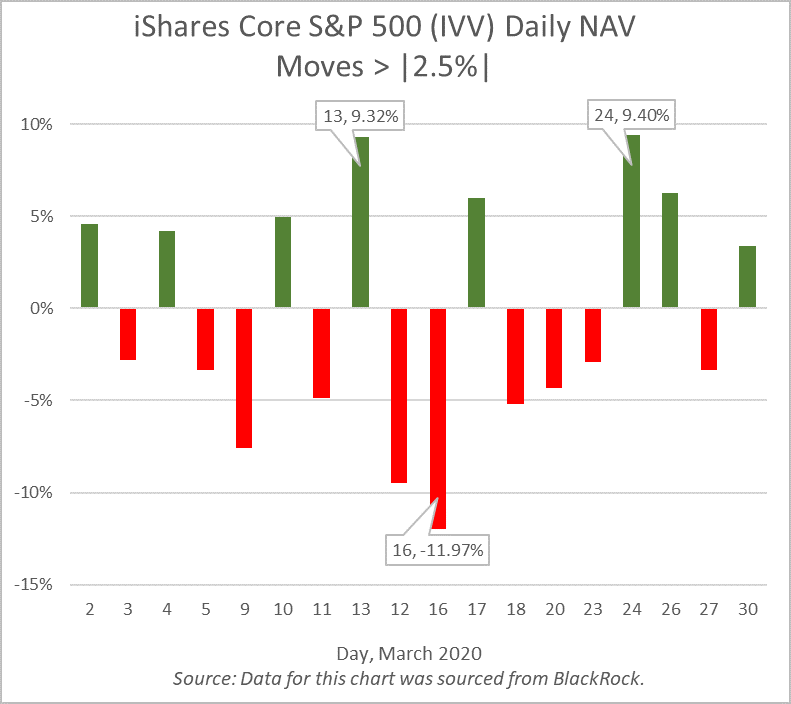
The ETF, ticker IVV, had daily NAV moves in excess of +/- 2.5% for 18 out of the 22 trading days in March. This included the March 16th decline of nearly 12%, the S&P’s third largest daily price decline in history (“Black Friday” is the largest daily price decline at -20.5%). As a result, the VIX Index, the market’s forward-looking indicator of volatility, closed at an all-time high of 82.69 the same day.
Alternative Mutual Funds, Passing the Test
The speed and volatility witnessed during the market drawdown was historic. Working with this understanding of the Corona Market, we can now visit AMF performance for this period within the appropriate lens. The following table represents the performance of the AI Insight universe of AMFs. AI Insight focuses our coverage on funds that execute alternative strategies designed to be held as part (or as all) of an alternative allocation. We also aim to limit our coverage to funds with established track records and sustainable levels of total AUM. The universe is organized into 7 strategy groups, for which the table presents the average performance of each.
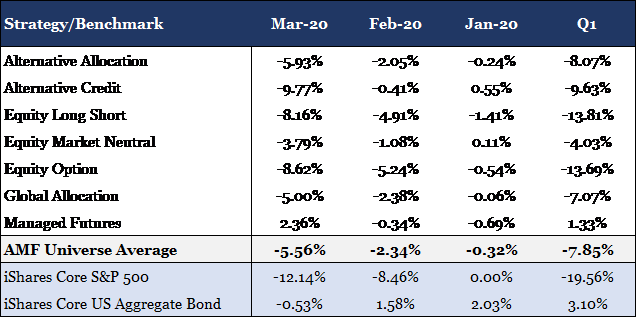
The data for the table was sourced from the AI Insight AMF database.
The strongest performer for the period was Managed Futures delivering positive 1.33% through the first quarter. It was the only strategy to remain in the black propelled by a positive 2.36% return during the month of March. Historically, Managed Futures have struggled to capture sharp price reversals as the strategy relies on sustained price trends to build portfolio positions. However, many managers today have increased their weighting toward short term trading strategies and trend signals to better capture downward price swings. This is often referred to as “crisis alpha”, the ability to capture persistent trends that occur across markets during turbulent periods.
Below the AMF universe average for the period were the equity and credit alternative strategies (e.g. Equity Long Short, Equity Option, and Alternative Credit). These funds will typically have higher exposures to risk assets, and as a result, a higher correlation to traditional markets. Furthermore, it is possible the orientation of this market crisis (virus induced shutdown) may have led managers to be more aggressive than they otherwise would have been in a low growth and/or fundamentally weak economy. Prior to the selloff, the financial health of companies and consumers was considerably stronger than what was seen in 2008.
One exception to the equity alternative strategies was Equity Market Neutral. More specifically, the Event Driven sub-strategy of Equity Market Neutral that focuses on mergers and acquisitions among other corporate related events. The sub-strategy was a stronger performer for the period delivering -2.83% performance through the first quarter. These funds are unique in that they invest almost exclusively in equity and equity related securities yet provide a low beta return profile. The -2.83% return equates to a 16.73% outperformance over the iShares Core S&P 500 ETF for the first quarter.
Conclusion
Overall, AMFs delivered strong relative results during the Corona Market with the universe average outperforming the S&P 500 by 11.71% during the first quarter. This included downside protection for both the month of February and March as the average outperformed the equity index by 6.12% and 6.58% respectively. Strategies performed as expected with the more correlated strategies under-performing the average AMF but still out-performing equities, and the less correlated strategies out-performing both the average AMF and the equity markets.
Consistent with these results was the Alternative Allocation strategy which delivered -8.07% for the first quarter as compared to the -7.85% return for the universe. These funds actively invest across multiple alternative strategies and managers within a single fund, providing broad exposure to alternative sources of return. Similarly, the strategy delivered downside protection in both February and March outperforming the equity index by 6.41% and 6.07% respectively.
As demonstrated during the first quarter of 2020, AMFs provide the potential for increased portfolio diversification and downside protection relative to traditional equities. This may serve to reduce portfolio risk during an equity selloff as witnessed during the Corona Market. As mentioned previously, the current low to equity markets occurred on March 23rd. However, there is still much uncertainty that remains around the COVID-19 virus such as potential treatments and vaccines, how best to re-open the economy, and how we will manage the increased debt load that the government and many companies are undertaking to weather the economic shutdown. Despite these uncertainties, equity markets have stabilized since the March 23rd lows appreciating approximately 27% on the backbone of positive hospitalization trends and historic fiscal and monetary policy measures (the S&P 500 is currently down 12.2% through Friday, April 24th). The road may be long, but as mentioned before, diversification is an effective tool in any risk management strategy.
Wednesday, April 8th, 2020 and is filed under Industry Reporting
We recently released our March Private Placement Insights. See the highlights from the report below, or if you are a Premium Reporting subscriber, log in now to see the entire report. If you don’t have access, you can request a free trial.
- 15 new private placements were added to our coverage in March, just below the last couple of months but still well over last year’s levels. The industry continues to be led by real estate focused categories including 1031s and real estate LPs and LLCs.
- As of April 1st, AI Insight covers 178 private placements currently raising capital, with an aggregate target raise of $17.6 billion and an aggregate reported raise of $8.8 billion or 50% of target. The average size of the current funds is $99.1 million, ranging from $3.5 million for a single asset real estate fund to $2.5 billion for a sector specific private equity/debt fund.
- 13 private placements closed in March, having raised approximately 70% of their target and having been on the market for an average of 311 days.
- ON DECK: as of April 1st, there were five new private placements coming soon.
Market Update: COVID-19 Impact on Private Placement Markets
On March 11, 2020, the World Health Organization (the WHO) declared the COVID-19 coronavirus a global pandemic. Trade and travel have since grind to a halt with travel restrictions and stay at home orders issued across the globe. The US and global economies are in recession territory, with GDP in the United States now forecast to decline by 0.2% instead of expanding by 2.0% in 2020 as a result of COVID-19. While the full impact of the global pandemic may take years to determine, the one thing we do know is that it will have a significant impact on all aspects of investing both in the public and private markets. Transactions are slowing across the private placement categories and valuations, which require transactions, may be less reliable or difficult to obtain.
Access the full Private Placements report and other hard-to-find alts data
AI Insight’s Industry Reporting capabilities help you review alternative investment trends and historical market data for Private Placements, Non-Traded REITs, BDCs, Closed-End Funds, and Alternative Mutual Funds. Receive up to 24 extensive reports per year to help broaden your alternative investment reviews.
Log in or subscribe to AI Insight to further research, sort, compare, and analyze all of the private and public funds in our coverage universe. See who’s new in the industry and what trends are impacting the alts space.
_________________________________
Chart and data as of March 31, 2020, based on programs activated on the AI Insight platform as of this date.
Activated means the program and education module are live on the AI Insight platform. Subscribers can view and download data for the program and access the respective education module.
On a subscription basis, AI Insight provides informational resources and training to financial professionals regarding alternative investment products and offerings. AI Insight is not affiliated with any issuer of such investments or associated in any manner with any offer or sale of such investments. The information above does not constitute an offer to sell any securities or represent an express or implied opinion on or endorsement of any specific alternative investment opportunity, offering or issuer. This report may not be shared, reproduced, duplicated, copied, sold, traded, resold or exploited for any purpose. Copyright ©2020 AI Insight. All Rights Reserved.
Friday, March 27th, 2020 and is filed under AI Insight News
 |
Your daily routine may be in disarray, but it’s business as usual at AI Insight since we have been successfully operating as virtual company for many years. As always, we’re here to help you with your AI Insight needs and anything else that might help you when working remotely.
To be successful working remotely, you need a strategy, focus and a little fun. We’ve compiled some resources that we’ve used in practice to help you accomplish this. |
Get Started
It’s important to designate a specific area that you use solely as your workspace to establish your “work zone” not only for your benefit, but for family members who are at home with you. Traveling around your house with your laptop or working where you sleep invites interruption.
Stay Focused
It’s easy to become distracted by the TV, social media or the pile of dishes in the sink. Creating a schedule for yourself – including breaks and lunchtime as you would at the office – can help you concentrate on your work. Setting a specific work schedule will also help you set expectations for other family members who are at home and help you keep a healthy work-life balance.
Industry Resources
You may be used to attending industry conferences or face-to-face group meetings, which have been postponed or cancelled. AI Insight created a central resource to help you stay connected with industry groups such as ADISA, IPA, FINRA and more. Check back frequently as we will continue to post industry webinar events happening in lieu of conferences.
Technology Resources
Having the right equipment is essential to working from home. But, knowing how to make the most of technology tools can be challenging.
- Zoom is a remote video conferencing and web conferencing service.
- Microsoft Teams is a unified communication and collaboration platform that combines workplace chat, video meetings, file storage, and application integration.
Stay Connected
We all know that miscommunication can happen over email and text. Convey your tone with a phone call instead of email when you can. Even better, turn on your video during online meetings to express your body language. Remember to test out your video feature before you use it publicly, so you can check your background surroundings and test your microphone.
This is also a good opportunity to get to know your co-workers on a personal level. At AI Insight, we’ve created a social channel within our Microsoft Teams platform to talk about topics unrelated to work and share photos on occasions like Halloween and St. Patrick’s Day. This helps us get to know each other better and stay connected.
Be Mindful
We’ve created a “Get Up & Move” rewards program at AI Insight to encourage everyone to walk away from their computer once an hour. We also host quarterly Lunch & Learns to help our team stay healthy in mind and body such as chair yoga sessions and meditation practices. Taking breaks can boost productivity and rejuvenate you when motivation drops.
Contact Us
From everyone at AI Insight, we want you to be safe and healthy. Again, we’ve been incorporating these practices for many years. If there’s something we can help you with on any of these topics, please reach out to us Monday through Friday from 8:00 a.m. to 6:00 p.m. at 877-794-9448 ext. 710 or any time at customercare@aiinsight.com.
Thursday, March 12th, 2020 and is filed under Industry Reporting
AI Insight currently covers 72 1031 exchange programs and 58 non-1031 real estate private placements. In our February 2020 Private Placement Industry Report, it shows that both categories are growing again in 2020, with 1031s continuing their record growth from the last couple of years.
We wanted to look at fees within both categories, from a current standpoint – what do fees look like now, and from a historical standpoint – have up-front selling commissions declined and have net proceeds increased?
Current Fees
To look at current fees, we utilized our Fee and Expense Report which compares fees on similar programs within our coverage universe. This report updates as programs close and new coverage is added. Below is a snapshot of programs raising capital as of March 9, 2020.
1031 Exchanges
- Up-front selling commission
- Industry Range: 5 – 6.55%
- Industry Average: 5.76%
- Net Proceeds (Before Acquisition Fees)
- Industry Range: 84.78 – 92.50%
- Industry Average: 90.11%
- Acquisition Fees and Expenses
- Industry Range: 0.16 – 13.25%
- Industry Average: 4.29%
- Liquidation Fees
- Industry Range: 1 – 8.50%
- Industry Average: 3.08%
Non-1031 Real Estate LPs and LLCs:
- Up-front selling commission
- Industry Range: 0 – 8%
- Industry Average: 5.49%
- Net Proceeds (Before Acquisition Fees)
- Industry Range: 86.50 – 98%
- Industry Average: 90.32%
- Acquisition Fees and Expenses
- Industry Range: 0 – 19%
- Industry Average: 2.74%
- Liquidation Fees
- Industry Range: 0 – 40%
- Industry Average: 7.98%
Historical Fees – Up-front Selling Commissions
Fees have always been a focus of regulatory concern, although up-front selling commissions have been at the forefront of regulatory scrutiny over the last decade. FINRA Regulatory Notice 15-02 required greater transparency into pricing including fees for direct participation programs and non-traded REITs. The DOL’s previously proposed Fiduciary Rule and now Regulation Best Interest, require financial professionals to carefully review and disclose the material fees and costs related to a client’s holdings.
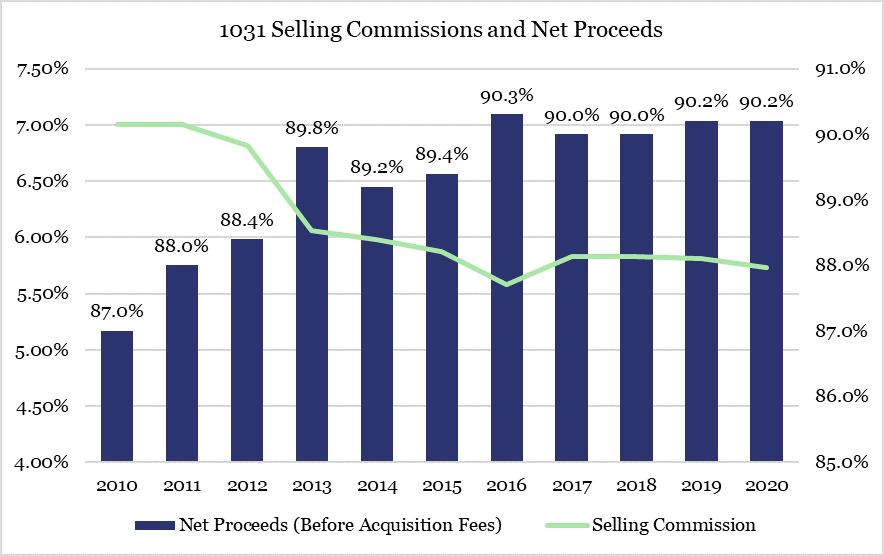
With this in mind, we reviewed the data on our platform for the real estate private placements we covered over the last decade to see if there has been any change in the average up-front selling commissions and the average net proceeds (before acquisition fees, which includes up-front fees and expenses taken from offering proceeds) for these programs.
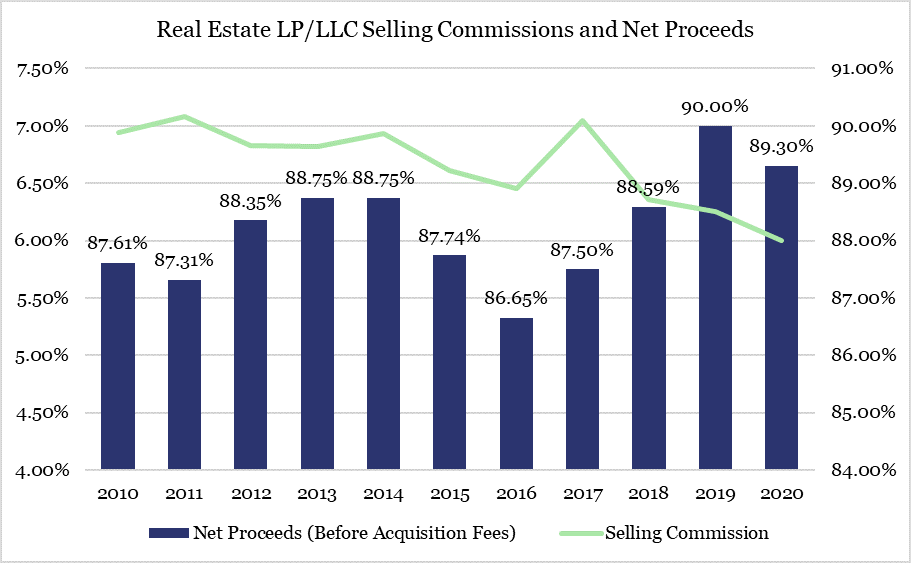
We found that up-front selling commissions have declined and net proceeds before acquisition fees has increased for 1031 exchanges and non-1031 real estate private placements over the last decade.
1031 selling commissions went from an average of 7% in 2010 to 5.73% for programs that opened in 2020, while the average net proceeds increased from 87 to 90.2%. This is a difference of approximately $3,200 on a $100,000 investment.
Results are similar for non-1031 real estate LPs and LLCs, with selling commissions declining from an average of 6.94% in 2010 to 6% in 2020. Net proceeds are up from 87.61% in 2010 to 89.30% in 2020 for a difference of $2,390 per $100,000 investment.
When looking at fees over time for real estate private placements, it appears the industry has responded to regulatory focus over the last decade by reducing up-front fees and expenses; even for private placements that may not be applicable to FINRA Regulatory Notice 15-02. However, real estate by its very nature can be an expensive asset class.
It is important to remember that although it may be good to see up-front fees decline, there are many other fees and expenses related to owning and operating direct real estate that must be considered reasonable including, but not limited to, construction costs, acquisition-related expenses, financing costs, leasing commissions, insurance and legal costs, and property management fees.