Wednesday, April 29th, 2020 and is filed under Alternative Strategy Mutual Funds
Introduction
As the dust settles from the Corona Market, albeit perhaps temporarily, it is prudent to revisit one’s portfolio and assess the effectiveness of your asset allocation. Diversification is an important component to risk management, and at no time is this better tested than during an equity selloff. Beyond the traditional stock and bond allocation, alternative investments can be an effective way to accomplish this. Broadly speaking, the asset class is designed to provide alternative sources of return to traditional market beta and provide the potential for capital preservation during market drawdowns. As such, it is good to assess the performance of alternatives during these periods to see if the hypothesis holds. Specifically, this piece will focus on alternative mutual fund (AMF) performance through the 1st quarter of 2020. AMFs offer exposure to “hedge fund-like” strategies among other non-traditional approaches within a mutual fund structure. Thus, they can be a liquid and cost-effective means to enhance portfolio diversification.
For the scope of this piece we will define the Corona Market as the equity declines experienced from February 19th through March 23rd. As much uncertainty around the COVID-19 virus and its economic impacts remain, it is important to understand that volatility may persist and that a new low may be established before the drawdown is officially measured. Working with this definition of the Corona Market allows us to make some unique observations about the recent market drawdown.
The Corona Market
The total loss to the S&P 500 Index, a barometer for US equity markets, amounted to 33.8%. According to data from the CFRA, the average loss experienced during all bear markets dating back to 1929 is 38.2%. Thus, from a historical perspective, the Corona Market was below average in magnitude. However, what made the drawdown so extreme was the speed in which it took place.

*Assumes that the March 23rd index low is the bottom of the Corona Market. Data for the table was sourced from CFRA and S&P Down Jones Indices.
As demonstrated by the table above, the Corona Market decline reached 20% (the definition of a bear market) in 22 calendar days. This is less than half the time it took markets to reach bear territory in 1987 (“Black Monday”) and far below the average of 254 calendar days dating back to 1929. The Corona Market also reached its current low in just 33 days. Such extreme price volatility highlights the uniqueness of a pandemic induced selloff. Taking a closer look, the following chart represents daily NAV changes in excess of +/- 2.5% for the iShares Core S&P 500 ETF (IVV), a passive ETF that tracks the returns of the S&P 500 Index.
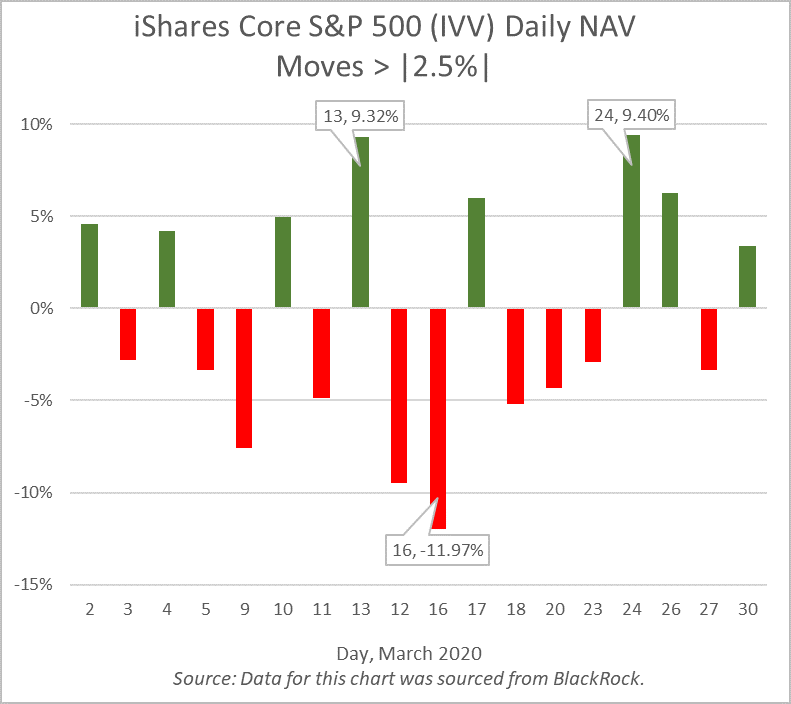
The ETF, ticker IVV, had daily NAV moves in excess of +/- 2.5% for 18 out of the 22 trading days in March. This included the March 16th decline of nearly 12%, the S&P’s third largest daily price decline in history (“Black Friday” is the largest daily price decline at -20.5%). As a result, the VIX Index, the market’s forward-looking indicator of volatility, closed at an all-time high of 82.69 the same day.
Alternative Mutual Funds, Passing the Test
The speed and volatility witnessed during the market drawdown was historic. Working with this understanding of the Corona Market, we can now visit AMF performance for this period within the appropriate lens. The following table represents the performance of the AI Insight universe of AMFs. AI Insight focuses our coverage on funds that execute alternative strategies designed to be held as part (or as all) of an alternative allocation. We also aim to limit our coverage to funds with established track records and sustainable levels of total AUM. The universe is organized into 7 strategy groups, for which the table presents the average performance of each.
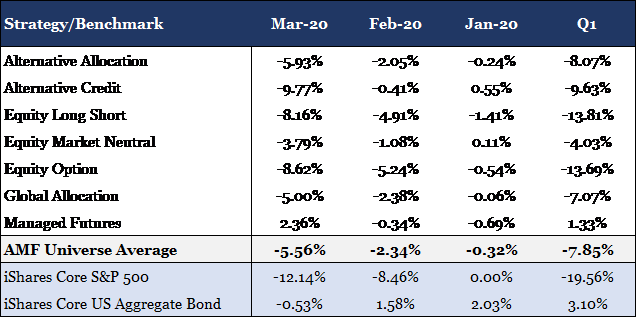
The data for the table was sourced from the AI Insight AMF database.
The strongest performer for the period was Managed Futures delivering positive 1.33% through the first quarter. It was the only strategy to remain in the black propelled by a positive 2.36% return during the month of March. Historically, Managed Futures have struggled to capture sharp price reversals as the strategy relies on sustained price trends to build portfolio positions. However, many managers today have increased their weighting toward short term trading strategies and trend signals to better capture downward price swings. This is often referred to as “crisis alpha”, the ability to capture persistent trends that occur across markets during turbulent periods.
Below the AMF universe average for the period were the equity and credit alternative strategies (e.g. Equity Long Short, Equity Option, and Alternative Credit). These funds will typically have higher exposures to risk assets, and as a result, a higher correlation to traditional markets. Furthermore, it is possible the orientation of this market crisis (virus induced shutdown) may have led managers to be more aggressive than they otherwise would have been in a low growth and/or fundamentally weak economy. Prior to the selloff, the financial health of companies and consumers was considerably stronger than what was seen in 2008.
One exception to the equity alternative strategies was Equity Market Neutral. More specifically, the Event Driven sub-strategy of Equity Market Neutral that focuses on mergers and acquisitions among other corporate related events. The sub-strategy was a stronger performer for the period delivering -2.83% performance through the first quarter. These funds are unique in that they invest almost exclusively in equity and equity related securities yet provide a low beta return profile. The -2.83% return equates to a 16.73% outperformance over the iShares Core S&P 500 ETF for the first quarter.
Conclusion
Overall, AMFs delivered strong relative results during the Corona Market with the universe average outperforming the S&P 500 by 11.71% during the first quarter. This included downside protection for both the month of February and March as the average outperformed the equity index by 6.12% and 6.58% respectively. Strategies performed as expected with the more correlated strategies under-performing the average AMF but still out-performing equities, and the less correlated strategies out-performing both the average AMF and the equity markets.
Consistent with these results was the Alternative Allocation strategy which delivered -8.07% for the first quarter as compared to the -7.85% return for the universe. These funds actively invest across multiple alternative strategies and managers within a single fund, providing broad exposure to alternative sources of return. Similarly, the strategy delivered downside protection in both February and March outperforming the equity index by 6.41% and 6.07% respectively.
As demonstrated during the first quarter of 2020, AMFs provide the potential for increased portfolio diversification and downside protection relative to traditional equities. This may serve to reduce portfolio risk during an equity selloff as witnessed during the Corona Market. As mentioned previously, the current low to equity markets occurred on March 23rd. However, there is still much uncertainty that remains around the COVID-19 virus such as potential treatments and vaccines, how best to re-open the economy, and how we will manage the increased debt load that the government and many companies are undertaking to weather the economic shutdown. Despite these uncertainties, equity markets have stabilized since the March 23rd lows appreciating approximately 27% on the backbone of positive hospitalization trends and historic fiscal and monetary policy measures (the S&P 500 is currently down 12.2% through Friday, April 24th). The road may be long, but as mentioned before, diversification is an effective tool in any risk management strategy.
Thursday, April 23rd, 2020 and is filed under AI Insight News
We recently hosted a webinar titled “COVID-19 Impact and Outlook, Alternative Investment Markets.” We were joined by three incredibly insightful speakers:
- Randy I. Anderson, Ph.D., CRE, President of Griffin Capital Asset Management Company
- Robert Hoffman, CFA, Managing Director, FS Investments
- Richard Kimble, CFA, Portfolio Manager, Americas for the Nuveen Global Cities REIT
See the key takeaways from our discussion with them as well as due diligence action steps provided by Mick Law, PC, or watch the full replay here:
Richard Kimble, Nuveen
- Real estate asset classes with shorter leases will suffer the most:
- Hospitality, seniors housing, student housing, discretionary retail
- Development will struggle
- Some retail will close for good
- Industrial, non-discretionary retail, and housing are in a better position:
- Multifamily and single-family rentals, life-sciences, technology (towers, data centers)
- Housing still has demographic trend benefits and now may be more difficult to own.
- US will continue to be a safe haven for overseas investors. Manhattan will still be a focus, but some groups may look to diversify to other large US cities.
- Real estate transactions are down:
- Of the deals awarded pre-crisis, some have gone through with purchases thinking this will be shorter-term V-shaped recovery, some backed out, and some pushed out 30-60 days to see if underwriting needs to be modified.
- Transactions slowing down but once there’s normalcy there will be a lot of transactions.
- It is critical to use well-known and trusted valuation firms to properly assess risk:
- They are using one of the largest third-party valuation firms that works with a number of clients and work with other appraisers similar to them to make sure the market is being consistent.
- Making sure people are consistently pricing in risk is key.
- For their fund, normally a third of the portfolio is appraised each month but during times like this they can appraise earlier.
- In Nuveen’s real estate platform, they have collected 94% of April rent.
- A handful have asked for payment plans and they are using creative strategies that can be used to ease the pain of the deferred rent.
- Not really working through force majeure because this doesn’t qualify for it or other MAC clauses, non-essential retail clients are struggling the most, but they want to be part of the solution to help make sure as many companies stay in business and keep as many employees – not abating rent but helping to defer.
- For example, many retailers asking for deferral for the next couple of months. They can work with tenants to amortize or add on to the end.
- They have set up a task force with a hotline to help small businesses access funds to stay in business.
- The real estate markets are in a stronger place than back in the global financial crisis (the GFC).
- For example, CMBS issuance 2017-2019 was less than half 2006-2007 time period. There is more discipline in lending, looking at in-place cash flow vs. forward looking NOI, more equity in transactions.
- Before COVID-19, they were maybe losing deals on the lending side due to pricing and structure or relationship, whereas before the GFC it was because other guy was giving more leverage. Covenants have also held up versus covenant lite environment pre-GFC.
- Looking at where traded REITs are now relative to NAV, and where spreads are, we’re seeing tremendous opportunities.
Robert Hoffman, FS Investments
- High yield bond markets will see volatility, defaults, downgrades, lack of CLO issuance, and fallout from the energy markets.
- Defaults may hit 10% later this year, compared to mid-teens in the GFC.
- Corporate bonds have proven to be resilient.
- There’s never been two years in a row that the HY debt market has been negative.
- When looking at the history of the high yield bond markets, when spreads are as wide as they are now, or around 800bps, the median 12-month forward return is 26%.
- This is probably not the time for broad, passive allocations, but the volatility creates opportunities.
- There will be volatility, but there are positives:
- The speed to which the Fed came into the market with the stimulus packages is helping the markets work more normally so risk can be properly priced and help speed the recovery.
- It also helps with resolving debt issues, if defaults or other actions can be worked out in a properly functioning market it lessens the impact.
- Public markets are seeing issuance and liquidity.
- Debt is more expensive and more situational but its moving.
- The fifth largest deal occurred last week amidst the pandemic.
- On the private debt side, most firms use reputable third-party valuation firms to mark to market as best and consistent as they can similar to real estate and there is also an analogous public market as an indication of value.
- Debt markets were so strong coming into this, and there is a fair amount of dry powder.
- Funds are more properly leveraged and have built up cash and been more defensive even prior to COVID-19.
- Most managers are taking care of their own book first, working with borrowers, and then will look to be opportunistic.
- Real estate debt is also in a better position than it was going into the GFC.
- Debt service coverage ratios are better than before, LTVs are more appropriate.
- Every downturn is different, but lenders are in a better position going into this.
- On the corporate debt side, there’s a much greater prevalence of covenant lite than pre-GFC:
- It remains to be seen what impact this has on the market and this could prove challenging.
- Covenant-lite loans recovered better than covenant-heavy post GFC but not sure that will happen again with significant weakening of fundamentals.
- Another factor that could be a challenge is a large shift to lower rated issuers from higher rated, and a higher percentage of loan-only Single B issuers as opposed to those issuing a loan and bond. However, ratings are higher than ever in history in the high-yield market and asset coverage is stronger than ever which may offset challenges.
Dr. Randy Anderson, Griffin Capital
- There will be volatility and the full impact depends on how long the virus takes to work its way through
- In this downturn as opposed to the GFC, two of the three legs of the chair are stable – fiscal (stimulus packages) and monetary (interest rate reductions) are a positive.
- The virus is the third leg and is variable. There is reason to be optimistic about a recovery in Q3 2020 but more likely in Q4.
- The IMF is forecasting the US economy to be down 6% 2020 and then stronger in 2021, up 4.7%.
- Markets have stabilized recently as the majority of the fear has been priced in.
- Many managers were already somewhat defensive going into this based on high real estate prices and low cap rates.
- They were expecting slower GDP growth anyways and were focused on defensive sectors including multifamily and industrial and had increased liquidity.
- Like Nuveen, they are seeing high levels of collections on multifamily. People need a place to live.
- Public REIT markets overreacted by a factor of almost 3 times during the GFC and proved to be a great investment post GFC.
- The forecast for real estate over the five to seven-year period hasn’t change, with 4-6% income and a similar amount based on appreciation based on inflation rates. With bumps and volatility. No one makes money trying to time the bottom.
- They have employed low leverage and lines of credit were not drawn (similar across many managers), so now they can take advantage of opportunities.
- May take some time to accurately price in risk, but most managers use highly competent third-party valuation experts who follow standards that are widely adopted. The standards require them to look at all conditions and fairly reflect those values.
- One of the main things investors can be looking at is if managers have unfunded commitments.
- It may be harder to raise capital in this environment, so you don’t want to have many outstanding unfunded commitments.
- Also want to have enough cash on hand, liquid securities if it is possible in fund structure, and lines of credit.
- It is important to play defense and then you also want to be positioned to play offense, when the third leg the virus starts to mitigate then markets will start to move and you want to be able to accretively acquire.
Due Diligence Action Steps (Provided by Mick Law, PC)
- Monitor for status updates for funds you have exposure to.
- Monitor for any suspensions of an offering, share redemptions, or distributions (AI Insight Alerts) and immediately communicate to investors.
- Proactively communicate the potential.
- Questions to ask sponsors in your discussions with them include have they:
- Taken any proactive measures to protect asset value?
- Adequately providing “specific information” to investors in offering materials and public filings about how COVID-19 “currently” affects, and may reasonably effect in the future, the operations and liquidity of such sponsors and their managed investment programs? The SEC has advised that it intends to monitor how companies are communicating with their investors concerning the effects of COVID-19.
- Able to service its debt and any portfolio debt?
- Able to continue operating without syndicating additional offerings in the short-term? (review financials)
- Adjusting their distribution payment policies appropriately to account for the present and future effects of COVID-19?
- For oil/gas sponsors that use reserve-based lines of credit,
- Are they appropriately prepared to address borrowing base deficiencies and related loan repayments in the probable event that their credit limits are adjusted due to lower commodities prices?
- For qualified opportunity fund (“QOF”) sponsors with identified asset funds,
- What adjustments are they having to make to development timelines?
- Do they still anticipate being able to meet the 30-month timeline to have their capital invested?
- If not, are they reserving money to pay any potential penalties?
- For QOF sponsors with partial or complete blind pool funds,
- What percentage of capital is already committed to projects (i.e., do they have capital available to take advantage of declining asset prices)?
Wednesday, April 8th, 2020 and is filed under Industry Reporting
We recently released our March Private Placement Insights. See the highlights from the report below, or if you are a Premium Reporting subscriber, log in now to see the entire report. If you don’t have access, you can request a free trial.
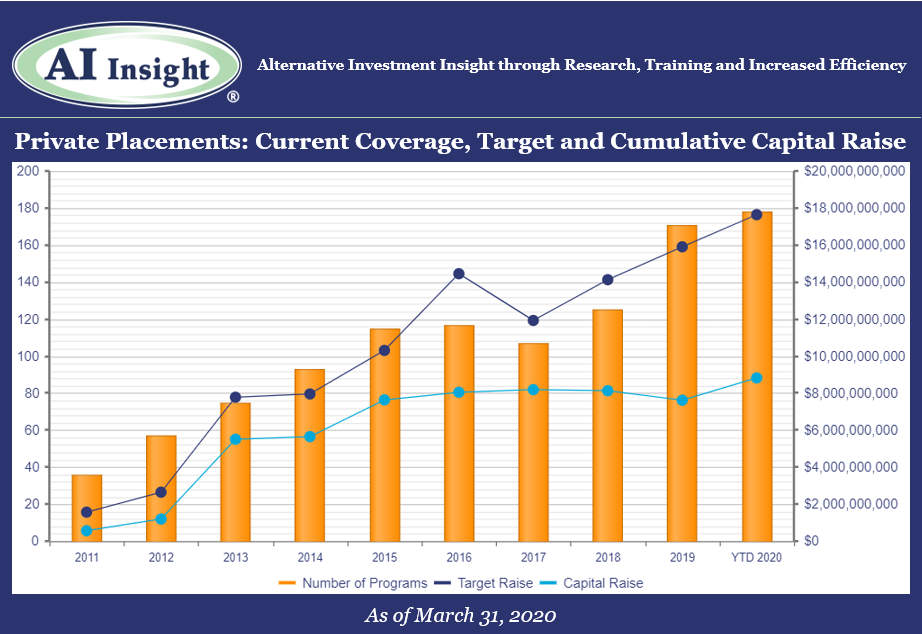
- 15 new private placements were added to our coverage in March, just below the last couple of months but still well over last year’s levels. The industry continues to be led by real estate focused categories including 1031s and real estate LPs and LLCs.
- As of April 1st, AI Insight covers 178 private placements currently raising capital, with an aggregate target raise of $17.6 billion and an aggregate reported raise of $8.8 billion or 50% of target. The average size of the current funds is $99.1 million, ranging from $3.5 million for a single asset real estate fund to $2.5 billion for a sector specific private equity/debt fund.
- 13 private placements closed in March, having raised approximately 70% of their target and having been on the market for an average of 311 days.
- ON DECK: as of April 1st, there were five new private placements coming soon.
Market Update: COVID-19 Impact on Private Placement Markets
On March 11, 2020, the World Health Organization (the WHO) declared the COVID-19 coronavirus a global pandemic. Trade and travel have since grind to a halt with travel restrictions and stay at home orders issued across the globe. The US and global economies are in recession territory, with GDP in the United States now forecast to decline by 0.2% instead of expanding by 2.0% in 2020 as a result of COVID-19. While the full impact of the global pandemic may take years to determine, the one thing we do know is that it will have a significant impact on all aspects of investing both in the public and private markets. Transactions are slowing across the private placement categories and valuations, which require transactions, may be less reliable or difficult to obtain.
Access the full Private Placements report and other hard-to-find alts data
AI Insight’s Industry Reporting capabilities help you review alternative investment trends and historical market data for Private Placements, Non-Traded REITs, BDCs, Closed-End Funds, and Alternative Mutual Funds. Receive up to 24 extensive reports per year to help broaden your alternative investment reviews.
Log in or subscribe to AI Insight to further research, sort, compare, and analyze all of the private and public funds in our coverage universe. See who’s new in the industry and what trends are impacting the alts space.
_________________________________
Chart and data as of March 31, 2020, based on programs activated on the AI Insight platform as of this date.
Activated means the program and education module are live on the AI Insight platform. Subscribers can view and download data for the program and access the respective education module.
On a subscription basis, AI Insight provides informational resources and training to financial professionals regarding alternative investment products and offerings. AI Insight is not affiliated with any issuer of such investments or associated in any manner with any offer or sale of such investments. The information above does not constitute an offer to sell any securities or represent an express or implied opinion on or endorsement of any specific alternative investment opportunity, offering or issuer. This report may not be shared, reproduced, duplicated, copied, sold, traded, resold or exploited for any purpose. Copyright ©2020 AI Insight. All Rights Reserved.
Friday, March 27th, 2020 and is filed under AI Insight News
 |
Your daily routine may be in disarray, but it’s business as usual at AI Insight since we have been successfully operating as virtual company for many years. As always, we’re here to help you with your AI Insight needs and anything else that might help you when working remotely.
To be successful working remotely, you need a strategy, focus and a little fun. We’ve compiled some resources that we’ve used in practice to help you accomplish this. |
Get Started
It’s important to designate a specific area that you use solely as your workspace to establish your “work zone” not only for your benefit, but for family members who are at home with you. Traveling around your house with your laptop or working where you sleep invites interruption.
Stay Focused
It’s easy to become distracted by the TV, social media or the pile of dishes in the sink. Creating a schedule for yourself – including breaks and lunchtime as you would at the office – can help you concentrate on your work. Setting a specific work schedule will also help you set expectations for other family members who are at home and help you keep a healthy work-life balance.
Industry Resources
You may be used to attending industry conferences or face-to-face group meetings, which have been postponed or cancelled. AI Insight created a central resource to help you stay connected with industry groups such as ADISA, IPA, FINRA and more. Check back frequently as we will continue to post industry webinar events happening in lieu of conferences.
Technology Resources
Having the right equipment is essential to working from home. But, knowing how to make the most of technology tools can be challenging.
- Zoom is a remote video conferencing and web conferencing service.
- Microsoft Teams is a unified communication and collaboration platform that combines workplace chat, video meetings, file storage, and application integration.
Stay Connected
We all know that miscommunication can happen over email and text. Convey your tone with a phone call instead of email when you can. Even better, turn on your video during online meetings to express your body language. Remember to test out your video feature before you use it publicly, so you can check your background surroundings and test your microphone.
This is also a good opportunity to get to know your co-workers on a personal level. At AI Insight, we’ve created a social channel within our Microsoft Teams platform to talk about topics unrelated to work and share photos on occasions like Halloween and St. Patrick’s Day. This helps us get to know each other better and stay connected.
Be Mindful
We’ve created a “Get Up & Move” rewards program at AI Insight to encourage everyone to walk away from their computer once an hour. We also host quarterly Lunch & Learns to help our team stay healthy in mind and body such as chair yoga sessions and meditation practices. Taking breaks can boost productivity and rejuvenate you when motivation drops.
Contact Us
From everyone at AI Insight, we want you to be safe and healthy. Again, we’ve been incorporating these practices for many years. If there’s something we can help you with on any of these topics, please reach out to us Monday through Friday from 8:00 a.m. to 6:00 p.m. at 877-794-9448 ext. 710 or any time at customercare@aiinsight.com.
Thursday, March 12th, 2020 and is filed under Industry Reporting
AI Insight currently covers 72 1031 exchange programs and 58 non-1031 real estate private placements. In our February 2020 Private Placement Industry Report, it shows that both categories are growing again in 2020, with 1031s continuing their record growth from the last couple of years.
We wanted to look at fees within both categories, from a current standpoint – what do fees look like now, and from a historical standpoint – have up-front selling commissions declined and have net proceeds increased?
Current Fees
To look at current fees, we utilized our Fee and Expense Report which compares fees on similar programs within our coverage universe. This report updates as programs close and new coverage is added. Below is a snapshot of programs raising capital as of March 9, 2020.
1031 Exchanges
- Up-front selling commission
- Industry Range: 5 – 6.55%
- Industry Average: 5.76%
- Net Proceeds (Before Acquisition Fees)
- Industry Range: 84.78 – 92.50%
- Industry Average: 90.11%
- Acquisition Fees and Expenses
- Industry Range: 0.16 – 13.25%
- Industry Average: 4.29%
- Liquidation Fees
- Industry Range: 1 – 8.50%
- Industry Average: 3.08%
Non-1031 Real Estate LPs and LLCs:
- Up-front selling commission
- Industry Range: 0 – 8%
- Industry Average: 5.49%
- Net Proceeds (Before Acquisition Fees)
- Industry Range: 86.50 – 98%
- Industry Average: 90.32%
- Acquisition Fees and Expenses
- Industry Range: 0 – 19%
- Industry Average: 2.74%
- Liquidation Fees
- Industry Range: 0 – 40%
- Industry Average: 7.98%
Historical Fees – Up-front Selling Commissions
Fees have always been a focus of regulatory concern, although up-front selling commissions have been at the forefront of regulatory scrutiny over the last decade. FINRA Regulatory Notice 15-02 required greater transparency into pricing including fees for direct participation programs and non-traded REITs. The DOL’s previously proposed Fiduciary Rule and now Regulation Best Interest, require financial professionals to carefully review and disclose the material fees and costs related to a client’s holdings.
With this in mind, we reviewed the data on our platform for the real estate private placements we covered over the last decade to see if there has been any change in the average up-front selling commissions and the average net proceeds (before acquisition fees, which includes up-front fees and expenses taken from offering proceeds) for these programs.
We found that up-front selling commissions have declined and net proceeds before acquisition fees has increased for 1031 exchanges and non-1031 real estate private placements over the last decade.
1031 selling commissions went from an average of 7% in 2010 to 5.73% for programs that opened in 2020, while the average net proceeds increased from 87 to 90.2%. This is a difference of approximately $3,200 on a $100,000 investment.
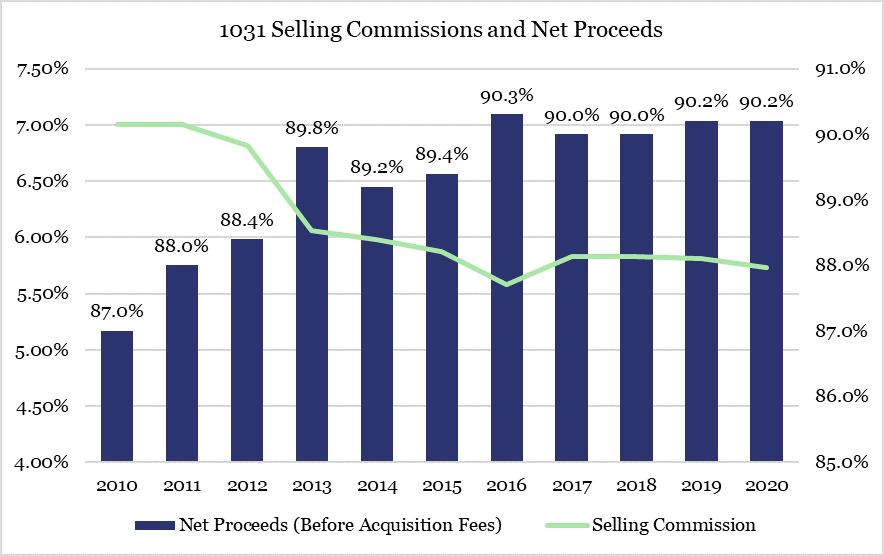
Results are similar for non-1031 real estate LPs and LLCs, with selling commissions declining from an average of 6.94% in 2010 to 6% in 2020. Net proceeds are up from 87.61% in 2010 to 89.30% in 2020 for a difference of $2,390 per $100,000 investment.
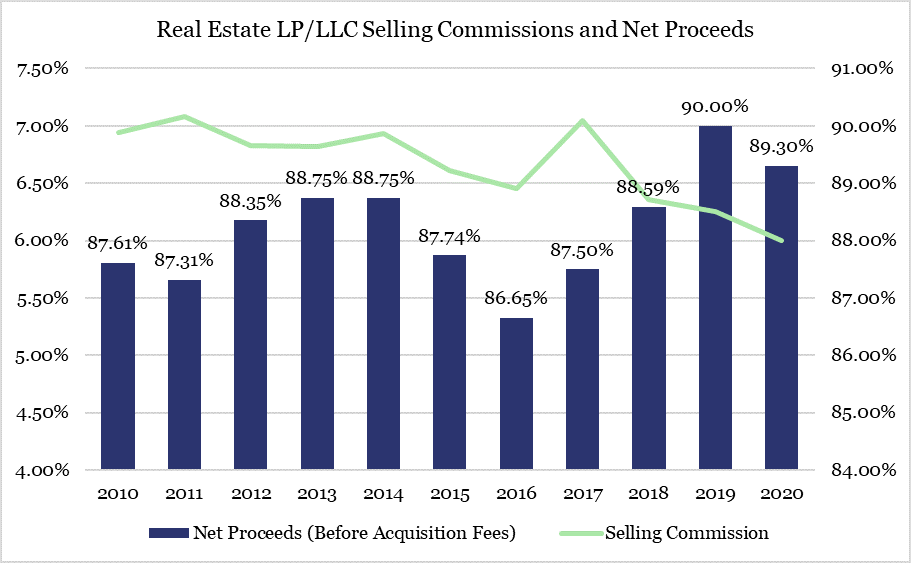
When looking at fees over time for real estate private placements, it appears the industry has responded to regulatory focus over the last decade by reducing up-front fees and expenses; even for private placements that may not be applicable to FINRA Regulatory Notice 15-02. However, real estate by its very nature can be an expensive asset class.
It is important to remember that although it may be good to see up-front fees decline, there are many other fees and expenses related to owning and operating direct real estate that must be considered reasonable including, but not limited to, construction costs, acquisition-related expenses, financing costs, leasing commissions, insurance and legal costs, and property management fees.
Monday, March 9th, 2020 and is filed under Industry Reporting
We recently released our February Private Placement Insights. See the highlights from the report below, or if you are an AI Insight Premium Reporting subscriber, log in now to see the entire report.
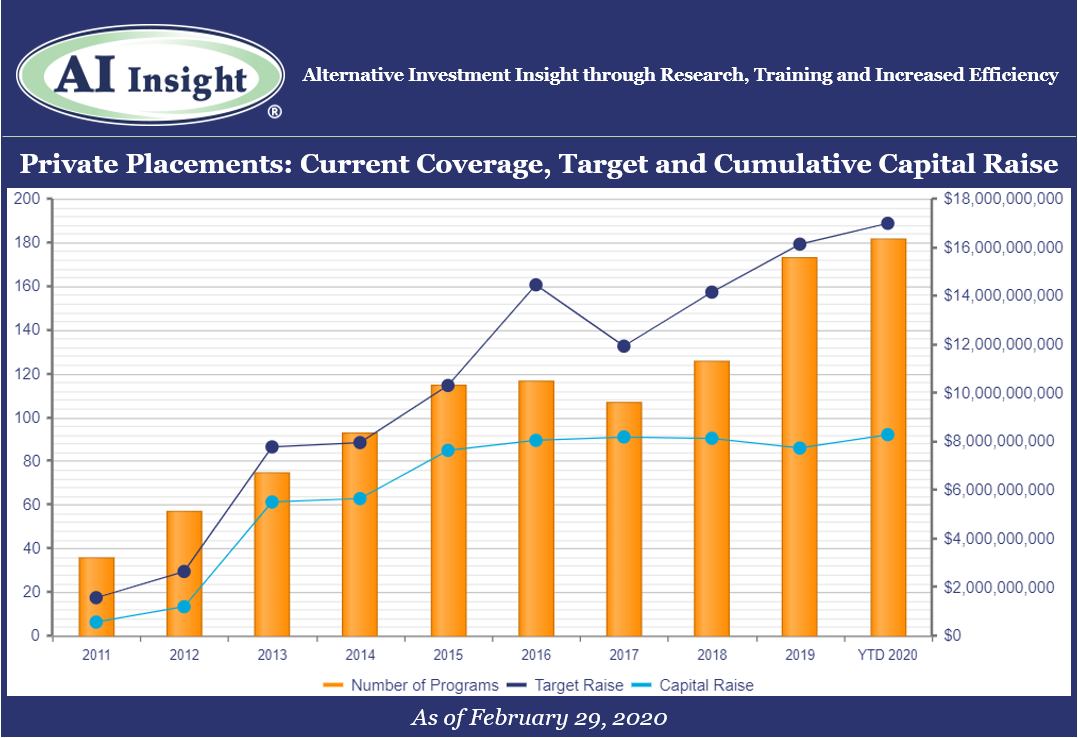
• 16 new private placements were added to our coverage in February, just below the last couple of months but still well over last year’s levels. The industry is again being led by the real estate focused categories including 1031s and real estate LPs and LLCs.
• As of March 1st, AI Insight covers 182 private placements currently raising capital, with an aggregate target raise of $17.0 billion and an aggregate reported raise of $8.3 billion or 49% of target. The average size of the current funds is $92.6 million, ranging from $3.5 million for a single asset real estate fund to $2.2 billion for a sector specific private equity/debt fund.
• 13 private placements closed in February, having raised approximately 87% of their target and having been on the market for an average of 393 days.
• ON DECK: as of March 1st, there were eight new private placements coming soon.
Access the full Private Placements report and other hard-to-find alts data
AI Insight’s Industry Reporting capabilities help you review alternative investment trends and historical market data for Private Placements, Non-Traded REITs, BDCs, Closed-End Funds, and Alternative Mutual Funds. Receive up to 24 extensive reports per year to help broaden your alternative investment reviews.
Log in or subscribe to AI Insight to further research, sort, compare, and analyze all of the private and public funds in our coverage universe. See who’s new in the industry and what trends are impacting the alts space.
_________________________________
Chart and data as of Feb. 29, 2020, based on programs activated on the AI Insight platform as of this date.
Activated means the program and education module are live on the AI Insight platform. Subscribers can view and download data for the program and access the respective education module.
On a subscription basis, AI Insight provides informational resources and training to financial professionals regarding alternative investment products and offerings. AI Insight is not affiliated with any issuer of such investments or associated in any manner with any offer or sale of such investments. The information above does not constitute an offer to sell any securities or represent an express or implied opinion on or endorsement of any specific alternative investment opportunity, offering or issuer. This report may not be shared, reproduced, duplicated, copied, sold, traded, resold or exploited for any purpose. Copyright ©2020 AI Insight. All Rights Reserved.
Monday, February 24th, 2020 and is filed under AI Insight News
2019 was a record year for private placements on the AI Insight platform. Our December Private Placement Industry Report showed we added 200 new private placements to our coverage with an average target raise of $58.5 million, led by 1031s, opportunity zones and non-1031 real estate funds. We also reported that 158 private placements closed in 2019, having raised approximately 85% of their target.
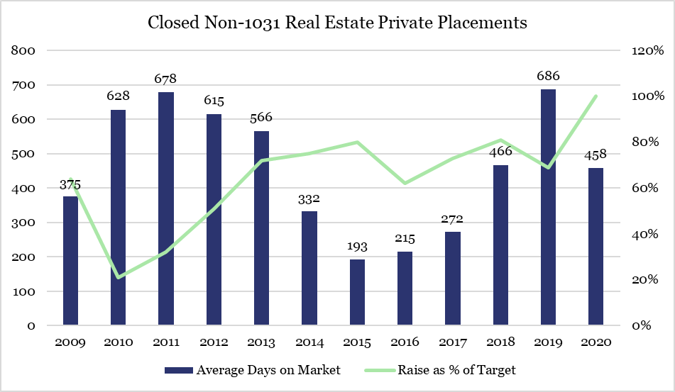
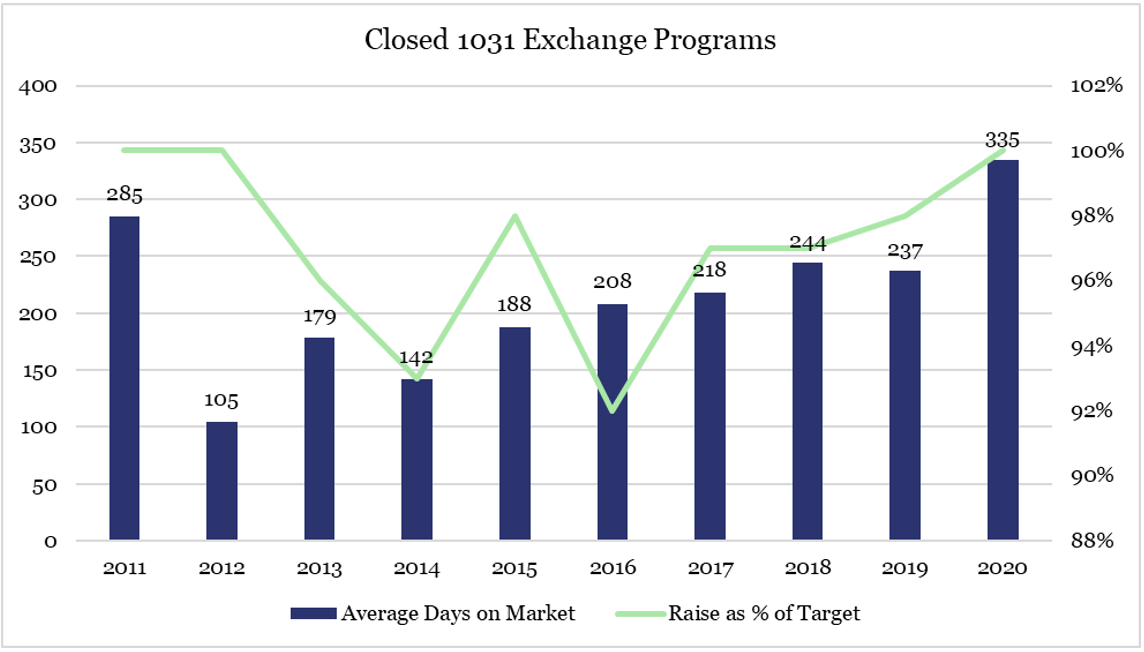
We recently analyzed the private placements on our platform that have closed to new investors since we started reporting in 2009 for a few statistics: (i) how long was the average fund within each category on the market (days on market), (ii) what was the average and range of capital raise targets and (iii) how close did the average fund come to meeting its capital raise target.
Overall, there are 987 funds on our platform that have closed to new investors since we started tracking data in 2009. The average target raise was $43.8 million, ranging from $800,000 to $4.1 billion. The average fund was on the market for 347 days and raised approximately 76% of its target.
Following is a closer look at some of the primary private placement categories. We report these and other statistics in our industry reports.
Private Real Estate
- 256 funds
- Real estate and real estate related securities
- LPs and LLCs
- Excludes 1031 exchanges and opportunity zone funds
- Target raise range per fund: $800k to $535 million
- Average days on market: 391
- Average raise as a percent of target
- Up to $25 million: 4%
- $25 million to $50 million: 3%
- $50 million and up: 4%
1031 Exchanges
- 442 funds
- 427 Delaware Statutory Trusts (DSTs) / 15 Tenant-in-Common (TICs)
- Target raise range per fund: $995k to $138.2 million
- Average days on market: 210
- Average raise as a percent of target
- Up to $25 million: 6%
- $25 million to $50 million: 6%
- $50 million and up: 100%
Energy
- 126 funds
- LPs and LLCs
- Target raise range per fund: $3.5 million to $300 million
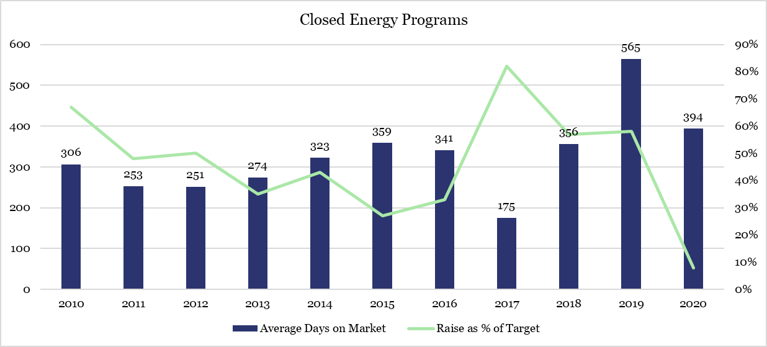
- Average days on market: 313
- Average raise as a percent of target: 8%
Opportunity Zones
- This is a new category with only five funds on our platform that have closed to date and we currently cover 15 additional funds.
- Target raise range per closed fund: $7 million to $335 million
- Average days on market: 248
- Average raise as a percent of target: 6%
Other Resources
_________________________________
Charts and data based on programs activated on the AI Insight platform.
Activated means the program and education module are live on the AI Insight platform. Subscribers can view and download data for the program and access the respective education module.
On a subscription basis, AI Insight provides informational resources and training to financial professionals regarding alternative investment products and offerings. AI Insight is not affiliated with any issuer of such investments or associated in any manner with any offer or sale of such investments. The information above does not constitute an offer to sell any securities or represent an express or implied opinion on or endorsement of any specific alternative investment opportunity, offering or issuer. This report may not be shared, reproduced, duplicated, copied, sold, traded, resold or exploited for any purpose. Copyright ©2020 AI Insight. All Rights Reserved.
Wednesday, February 12th, 2020 and is filed under AI Insight News
FINRA recently issued its 2020 Risk Monitoring and Examination Priorities Letter along with its 2019 Report on Examination Findings and Observations. As expected, Regulation Best Interest (Reg BI) takes the lead in this discussion. These reports also highlight, among other things, the continued focus on sales practices regarding supervision and client suitability.
Specifically, the 2020 Priorities Letter states,
“In the first part of the year, FINRA will review firms’ preparedness for Reg BI to gain an understanding of implementation challenges they face and, after the compliance date, will examine firms’ compliance with Reg BI, Form CRS and related SEC guidance and interpretations. FINRA staff expects to work with SEC staff to ensure consistency in examining broker-dealers and their associated persons for compliance with Reg BI and Form CRS.”
The 2019 Findings Report stated,
“Some firms did not have adequate systems of supervision to review that recommendations were suitable in light of a customer’s individual financial situation and needs, investment experience, risk tolerance, time horizon, investment objectives, liquidity needs and other investment profile factors. This report shares some new suitability-related findings, as well as additional nuances on prior years’ findings.”
Cybersecurity
At the end of the letter, FINRA addresses firm operations, technology and cybersecurity noting, “FINRA recognizes that there is no one-size-fits-all approach to cybersecurity, but expects firms to implement controls appropriate to their business model and scale of operations.”
Key Takeaways
- See this checklist, which explains key differences between FINRA rules and Reg BI and Form CRS.
- Carefully review and understand the specific suitability requirements for each non-traded or private placement program utilized and ensure that your firm has a documented process in place to monitor the compliance with suitability requirements.
- Document the due diligence process – remember, if it isn’t documented, it was never done.
- Review how regulators look at cybersecurity and key strategies to be compliant. Click here for additional resources and take the CE Course, “Cybersecurity Awareness for Financial Professionals”.
Let AI Insight help you stay compliant
- Discover how you can create efficiencies in your due diligence review process using our database of 350+ alternative investments to source new products as well as analyze and compare hundreds of alternative investment programs, including non-traded programs, private placements, and alternative mutual funds.
- Demonstrate your due diligence by conducing product-specific training on the features, risks and suitability for hundreds of offerings.
- Document what you’re doing to support your firm’s regulatory requirements in a transparent way. AI Insight captures all of the activity you and your firm members complete within the platform including training modules, offering document reviews and research conducted.
Resources
Tuesday, February 11th, 2020 and is filed under Industry Reporting
We recently released our January Private Placement Insights. See the highlights from the report below, or if you are a subscriber, log in now to see the entire report.
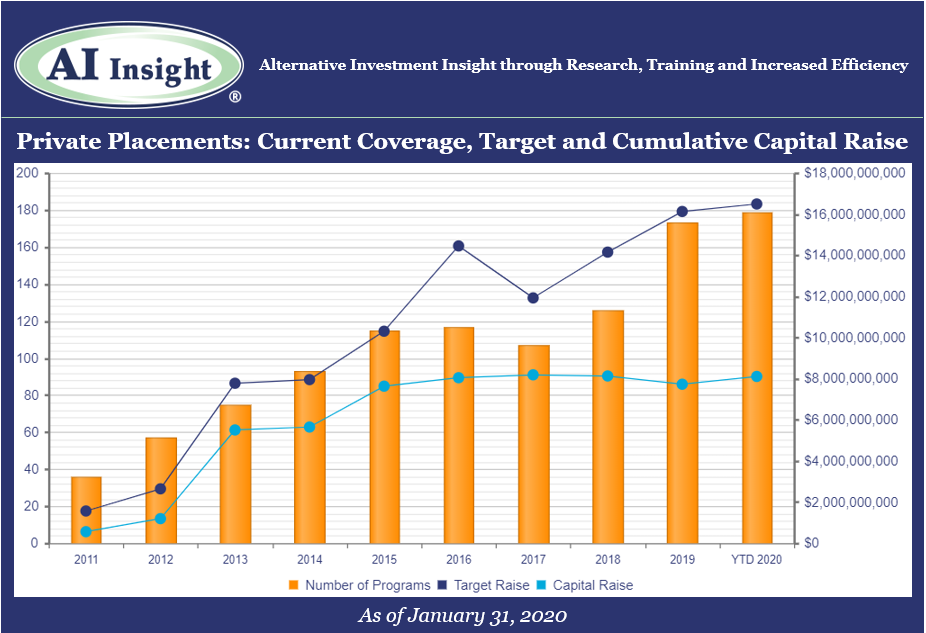
- 17 new private placements were added to our coverage in January, less than December’s record month, but higher on a year-over-year basis. The industry is again being led by 1031 exchanges, although target raise is higher than last year in all but one category.
- As of February 1st, AI Insight covers 179 private placements currently raising capital, with an aggregate target raise of $16.5 billion and an aggregate reported raise of $8.1 billion or 49% of target. The average size of the current funds is $92.1 million, ranging from $3.4 million for a single asset real estate fund to $2.2 billion for a sector specific private equity/debt fund.
- 13 private placements closed in January, having raised approximately 96% of their target.
- ON DECK: as of February 1st, there were 11 new private placements coming soon.
Access the full Private Placements report and other hard-to-find alts data
AI Insight’s Industry Reporting capabilities help you review alternative investment trends and historical market data for Private Placements, Non-Traded REITs, BDCs, Closed-End Funds, and Alternative Mutual Funds. Receive up to 24 extensive reports per year to help broaden your alternative investment reviews.
Log in or subscribe to AI Insight to further research, sort, compare, and analyze all of the private and public funds in our coverage universe. See who’s new in the industry and what trends are impacting the alts space.
_________________________________
Chart and data as of Jan. 31, 2020, based on programs activated on the AI Insight platform as of this date.
Activated means the program and education module are live on the AI Insight platform. Subscribers can view and download data for the program and access the respective education module.
On a subscription basis, AI Insight provides informational resources and training to financial professionals regarding alternative investment products and offerings. AI Insight is not affiliated with any issuer of such investments or associated in any manner with any offer or sale of such investments. The information above does not constitute an offer to sell any securities or represent an express or implied opinion on or endorsement of any specific alternative investment opportunity, offering or issuer. This report may not be shared, reproduced, duplicated, copied, sold, traded, resold or exploited for any purpose. Copyright ©2020 AI Insight. All Rights Reserved.
Friday, January 24th, 2020 and is filed under Alternative Strategy Mutual Funds
If your firm approves all fund company mutual funds, additional due diligence may be needed based on continued regulatory guidance on alternative strategy mutual funds.
_________________________________________________________________________________________
Some financial firms have raised questions about the need for conducting additional research on alternative mutual funds given their complex structure compared to traditional mutual funds. Both FINRA and the SEC have published supporting regulatory detail to help differentiate the need for additional due diligence on alternative mutual funds.
How are you demonstrating your understanding of the complexities of alternative strategy mutual funds?
According to PwC’s recent report, Alternative asset management 2020-Fast forward to centre stage, “In the light of the attention from regulators, asset management firms should enter this new line of business well-prepared from a compliance and organisational standpoint. This includes:
- training
- assessing customer suitability
- marketing and education
- building out compliance and surveillance, and
- robust liquidity risk management.”
Take the first step. Let AI Insight help your firm:
1) Identify potential risk exposure
2) Determine due diligence needs
3) Establish policies and procedures around Alternative Strategy Mutual Funds
Contact us for a complimentary Risk Exposure Analysis to see if your firm may need to conduct additional due diligence on alternative strategy mutual funds.
Related Regulatory References
Training Resources


