Friday, November 23rd, 2018 and is filed under AI Insight News
- There were 8 new 1031 programs activated on the AI Insight platform in October for a combined $266.9 million in total offering amount.
- The category is up 67.4% from the prior year in total YTD offering amount, and is on track to exceed 2016’s record of number of programs activated.
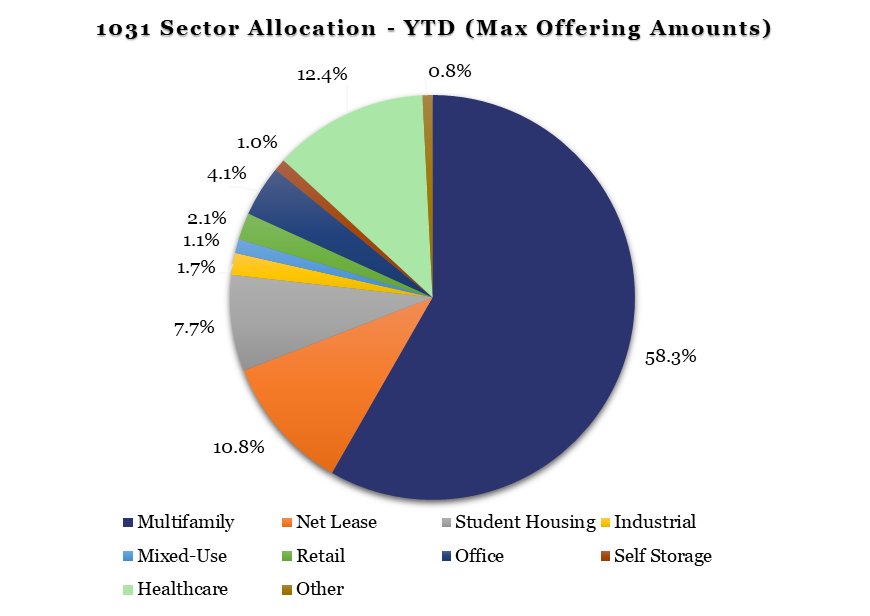
- Multifamily remains the top sector within the 1031 space, with 35 of the 72 programs and 58.3% of max offering amount. Healthcare, Net Lease, and Student Housing are next, representing 12.4%, 10.8%, and 7.7%, respectively, while Retail and Industrial represent less than 3.0% each – a major change from the pre-recession marketplace.
- ON DECK: As of November 21, six DST programs activated in November with one more coming soon.
AI Insight is introducing Industry Reporting in the first quarter of 2019, which will include this data and many more insights into key non-traded markets. To inquire about accessing these expansive data reports, please contact us directly.
Thursday, November 8th, 2018 and is filed under AI Insight News
Qualified Opportunity Zone investments are quickly gaining interest as new offerings are becoming available. Read the introductory FAQ below to learn more.
What are Qualified Opportunity Zones?
An Opportunity Zone is a community nominated by the state and certified by the Secretary of the U.S. Treasury. These are typically located in areas under economic distress or in low income communities. Opportunity Zones were added to the tax code by the Tax Cuts and Jobs Act in December 2017, with the purpose of encouraging economic development and job creation in these distressed areas.
What are Qualified Opportunity Funds?
A Qualified Opportunity Fund (QOF) is a new investment vehicle that is set up as either a partnership or corporation and may be eligible for preferential tax treatment. The Fund invests in eligible property located in a Qualified Opportunity Zone using the investor’s gains from a previous investment to fund the QOF.
What is considered a Qualified Opportunity Zone?
Many commercial, industrial and residential areas in the U.S. are considered eligible property for designation. According to CNBC.com:
- More than 8,700 properties across the country have already been certified as opportunity zones.
- About 90 percent of Opportunity Funds’ capital must be invested in projects located in deemed opportunity zones.
- Eligible projects include investing in new development, a property upgrades or funding a start-up business.
What are the potential benefits?
The new tax law outlines two major incentives: 1) The temporary deferral of inclusion in gross income for capital gains reinvested in a QOF, and 2) the permanent exclusion of capital gains must apply only to the appreciation in the investment in the QOF.
Specific tax exclusion benefits include:
- All gains invested in the QOF may be deferred in the year the temporary deferral election is made.
- Investments held in the QOF:
- For at least five years, will receive a basis increase equal to 10%;
- For at least seven years, will receive an additional basis increase of 5%, for a total increase of 15%;
- For at least 10 years, will receive permanent exclusion from taxable income of capital gains from the sale or exchange of an investment. This exclusion applies to the gains accrued from an investment in a QOF and not the original gains invested.
Where can I learn more?
Visit the FAQs put together by the IRS, read this article recently published by Sound West’s President Greg Genovese, as well as this article by the Economic Innovation Group, which discusses how the zones were created and includes a nationwide map.
AI Insight is currently working with fund sponsors who are considering offering Opportunity Zone Funds and we have begun launching these offerings on our platform, along with the hundreds of open and closed alternative investments we currently offer to help with your regulatory-compliance needs.
AI Insight also includes Opportunity Zone investments as a new category in our private placement industry reporting provided monthly. You can also take an Opportunity Zone CE course for generic education as part of our extensive e-learning library. We are also available as a platform for customized training and unbiased product-level research.
If you do not currently subscribe to AI Insight and would like to learn more, contact us to request a live tour.
Information sources: Treasury.gov and IRS.gov
Monday, October 29th, 2018 and is filed under AI Insight News
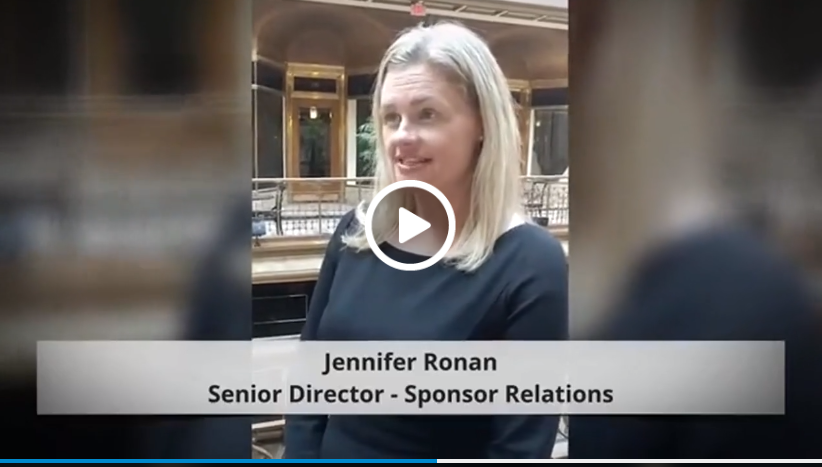
Do you have a new Alternative Investment offering? Hear from Jen Ronan about how AI Insight will provide an unbiased presentation of your program facts, features and risks, offering RIAs and FAs easy access to your current offering documents including updates to quarterly performance. View Vlog
Tuesday, October 23rd, 2018 and is filed under AI Insight News
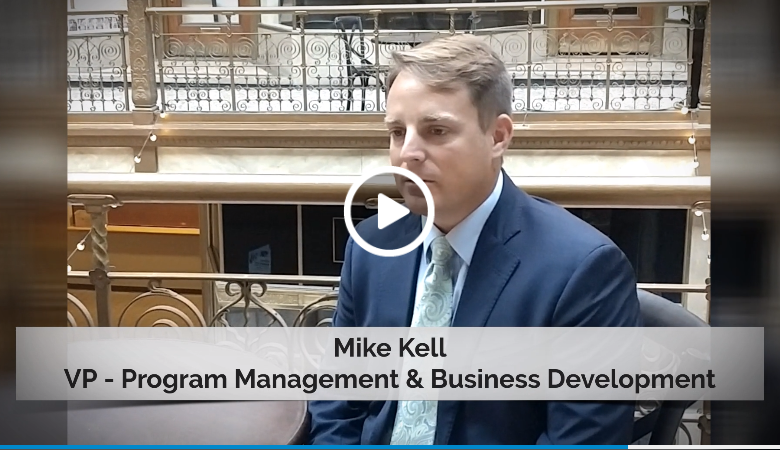
Do you understand the complexities of Alternative Mutual Funds? Hear from Mike Kell about how AI Insight can help you research and apply these investments in your practice. View vlog
Tuesday, October 16th, 2018 and is filed under AI Insight News
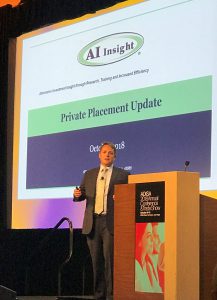 Last week AI Insight attended the ADISA Annual Conference in Las Vegas, NV. AI Insight’s Mike Kell, Senior Vice President of Business Development and Program Management, presented an update on Private Placement industry trends during the General Session.
Here are three key takeaways to consider:
- Similar to the recent IPA Vision Conference, Qualified Opportunity Zone investments were a prevalent topic. We recommend reading an article recently published by Sound West’s President Greg Genovese explaining more about the growing interest around these investments.
- RIAs are beginning to take a closer look at Alternative Investments. There has been an upward trend of portfolio allocation to alts among RIAs over the last couple of years. While the need for diligent product reviews and the associated paperwork present some capacity barriers, AI Insight was highlighted as the go-to research and compliance tracking tool to help streamline this process for RIAs.
- Regulatory processes for broker-dealers and RIAs are becoming more closely aligned. Broker dealer firms have prioritized implementing consistent due diligence policies. Given increased scrutiny, RIAs are becoming more like broker dealers with respect to advertising rules and implementing procedures given regulatory guidance to help increase transparency.
Monday, October 15th, 2018 and is filed under AI Insight News
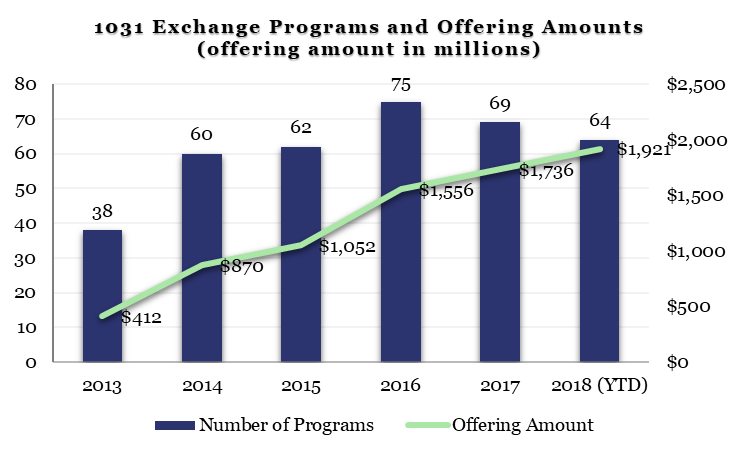
- There were 8 new 1031 programs activated on the AI Insight platform in September for a combined $331.6 million in total offering amount, with 64 activated YTD for a total offering amount of $1.9 billion.
- 63 of the 64 programs activated were DSTs, and the other was a TIC.
- The aggregate September offering amount was above August levels and the category has already exceeded FY 2017 offering amounts.
AI Insight is introducing Industry Reporting in the first quarter of 2019, which will include this data and many more insights into key non-traded markets. To inquire about accessing these expansive data reports, please contact us directly.
Wednesday, October 10th, 2018 and is filed under AI Insight News
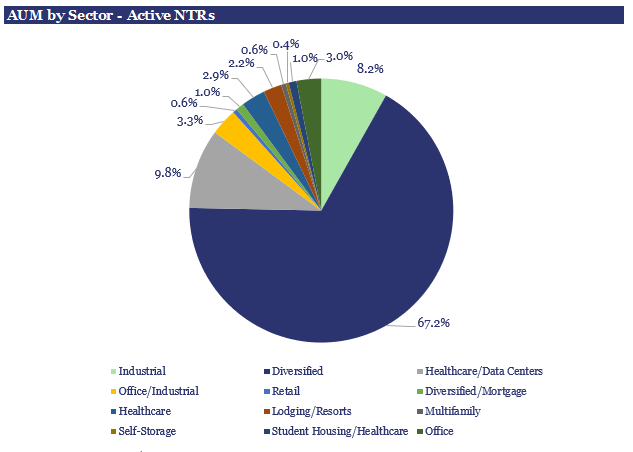
Total AUM for the non-traded REIT market remained steady in Q2 2018 at $86.2 billion, a tiny slice of the $1.145 trillion traded REIT market.
- Open programs represent $19.5 billion or 23% of this total, a larger percentage than prior quarters as capital raise has increased for active NTRs and older generation NTRs have liquidated assets.
- In terms of sector exposures, the industry is primarily allocated to diversified programs at 67.2% of total AUM, with healthcare/data center and industrial programs the closest competitors at 9.8% and 8.2% of total AUM, respectively.
AI Insight is introducing Industry Reporting in the first quarter of 2019, which will include this and many more insights into the key non-traded markets. To inquire about accessing these expansive data reports, please contact us directly.
Tuesday, October 9th, 2018 and is filed under AI Insight News
Hear from Sales Consultant Andy Van Erp about how AI Insight can help you get the training, education and research tools you need to work with complex products, and easily manage your compliance requirements. View vlog

Friday, October 5th, 2018 and is filed under AI Insight News
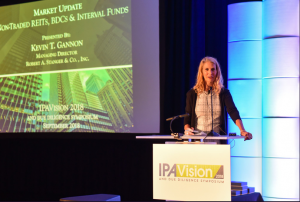 Last week AI Insight attended the annual IPA Vision and Due Diligence Symposium hosted by the Institute for Portfolio Alternatives in Chicago, IL. AI Insight CEO & President Sherri Cooke presented updates on the current state of the alternative investment industry.
Here are three key takeaways to consider:
- Qualified Opportunity Zone investments are quickly gaining interest. While there’s not yet any product available, there was a lot of excitement around Qualified Opportunity Funds. Discussions about potential benefits for gain deferral and tax exclusions were balanced by the possibility that capital gains rates may be higher in the future. No matter what, offering these investments will require significant education.
- States move toward implementing “best interest” regulation. While the DOL Fiduciary Rule is dead, the SEC’s Proposed Best Interest Regulation has prompted states like Nevada and New Jersey to move toward issuing their own fiduciary rules to govern brokerage firms in their respective states. Other states are expected to follow with fiduciary standards for both broker dealers and RIAs indicating the essence of the DOL rule still exists.
- Transparency continues to be a key priority. Establishing and implementing consistent due diligence policies and procedures continues to be a priority as regulators take a closer look at usage of complex investments. RIAs are following suit with broker dealers by creating more robust reviews around operations, legal documents and on-site visits to improve transparency.
Thursday, September 13th, 2018 and is filed under AI Insight News
A review of private placements on the AI Insight Platform:
1031 Exchange Programs
- There were 7 new 1031 programs activated on the AI Insight platform in August for a total of $228.6 million in total offering amount, with 56 activated YTD as of the end of August for a total offering amount of $1.6 billion.
- The aggregate August offering amount was above July levels. However, the YTD gains have slowed, down from 70% to 51% above 2017 YTD levels.
- The industry remains dominated by the top sponsor, who represents 29% of the offering amount YTD. However, several new sponsors have entered the market this year, taking some of the market share from the top sponsor.
Click here to view more AI Insight Private Placement data and charts.