Wednesday, April 8th, 2020 and is filed under Industry Reporting
We recently released our March Private Placement Insights. See the highlights from the report below, or if you are a Premium Reporting subscriber, log in now to see the entire report. If you don’t have access, you can request a free trial.
- 15 new private placements were added to our coverage in March, just below the last couple of months but still well over last year’s levels. The industry continues to be led by real estate focused categories including 1031s and real estate LPs and LLCs.
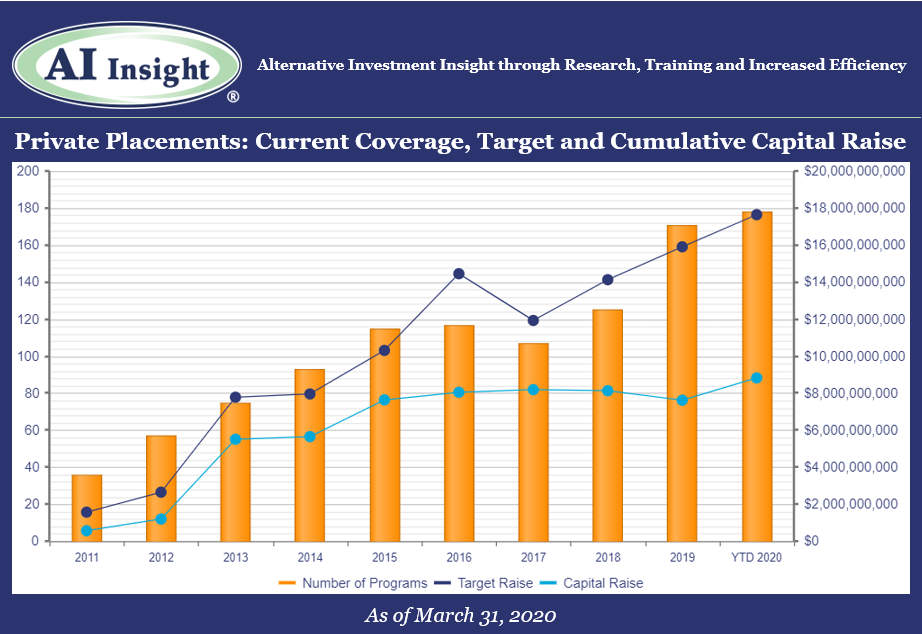
- As of April 1st, AI Insight covers 178 private placements currently raising capital, with an aggregate target raise of $17.6 billion and an aggregate reported raise of $8.8 billion or 50% of target. The average size of the current funds is $99.1 million, ranging from $3.5 million for a single asset real estate fund to $2.5 billion for a sector specific private equity/debt fund.
- 13 private placements closed in March, having raised approximately 70% of their target and having been on the market for an average of 311 days.
- ON DECK: as of April 1st, there were five new private placements coming soon.
Market Update: COVID-19 Impact on Private Placement Markets
On March 11, 2020, the World Health Organization (the WHO) declared the COVID-19 coronavirus a global pandemic. Trade and travel have since grind to a halt with travel restrictions and stay at home orders issued across the globe. The US and global economies are in recession territory, with GDP in the United States now forecast to decline by 0.2% instead of expanding by 2.0% in 2020 as a result of COVID-19. While the full impact of the global pandemic may take years to determine, the one thing we do know is that it will have a significant impact on all aspects of investing both in the public and private markets. Transactions are slowing across the private placement categories and valuations, which require transactions, may be less reliable or difficult to obtain.
Access the full Private Placements report and other hard-to-find alts data
AI Insight’s Industry Reporting capabilities help you review alternative investment trends and historical market data for Private Placements, Non-Traded REITs, BDCs, Closed-End Funds, and Alternative Mutual Funds. Receive up to 24 extensive reports per year to help broaden your alternative investment reviews.
Log in or subscribe to AI Insight to further research, sort, compare, and analyze all of the private and public funds in our coverage universe. See who’s new in the industry and what trends are impacting the alts space.
_________________________________
Chart and data as of March 31, 2020, based on programs activated on the AI Insight platform as of this date.
Activated means the program and education module are live on the AI Insight platform. Subscribers can view and download data for the program and access the respective education module.
On a subscription basis, AI Insight provides informational resources and training to financial professionals regarding alternative investment products and offerings. AI Insight is not affiliated with any issuer of such investments or associated in any manner with any offer or sale of such investments. The information above does not constitute an offer to sell any securities or represent an express or implied opinion on or endorsement of any specific alternative investment opportunity, offering or issuer. This report may not be shared, reproduced, duplicated, copied, sold, traded, resold or exploited for any purpose. Copyright ©2020 AI Insight. All Rights Reserved.
Thursday, March 12th, 2020 and is filed under Industry Reporting
AI Insight currently covers 72 1031 exchange programs and 58 non-1031 real estate private placements. In our February 2020 Private Placement Industry Report, it shows that both categories are growing again in 2020, with 1031s continuing their record growth from the last couple of years.
We wanted to look at fees within both categories, from a current standpoint – what do fees look like now, and from a historical standpoint – have up-front selling commissions declined and have net proceeds increased?
Current Fees
To look at current fees, we utilized our Fee and Expense Report which compares fees on similar programs within our coverage universe. This report updates as programs close and new coverage is added. Below is a snapshot of programs raising capital as of March 9, 2020.
1031 Exchanges
- Up-front selling commission
- Industry Range: 5 – 6.55%
- Industry Average: 5.76%
- Net Proceeds (Before Acquisition Fees)
- Industry Range: 84.78 – 92.50%
- Industry Average: 90.11%
- Acquisition Fees and Expenses
- Industry Range: 0.16 – 13.25%
- Industry Average: 4.29%
- Liquidation Fees
- Industry Range: 1 – 8.50%
- Industry Average: 3.08%
Non-1031 Real Estate LPs and LLCs:
- Up-front selling commission
- Industry Range: 0 – 8%
- Industry Average: 5.49%
- Net Proceeds (Before Acquisition Fees)
- Industry Range: 86.50 – 98%
- Industry Average: 90.32%
- Acquisition Fees and Expenses
- Industry Range: 0 – 19%
- Industry Average: 2.74%
- Liquidation Fees
- Industry Range: 0 – 40%
- Industry Average: 7.98%
Historical Fees – Up-front Selling Commissions
Fees have always been a focus of regulatory concern, although up-front selling commissions have been at the forefront of regulatory scrutiny over the last decade. FINRA Regulatory Notice 15-02 required greater transparency into pricing including fees for direct participation programs and non-traded REITs. The DOL’s previously proposed Fiduciary Rule and now Regulation Best Interest, require financial professionals to carefully review and disclose the material fees and costs related to a client’s holdings.
With this in mind, we reviewed the data on our platform for the real estate private placements we covered over the last decade to see if there has been any change in the average up-front selling commissions and the average net proceeds (before acquisition fees, which includes up-front fees and expenses taken from offering proceeds) for these programs.
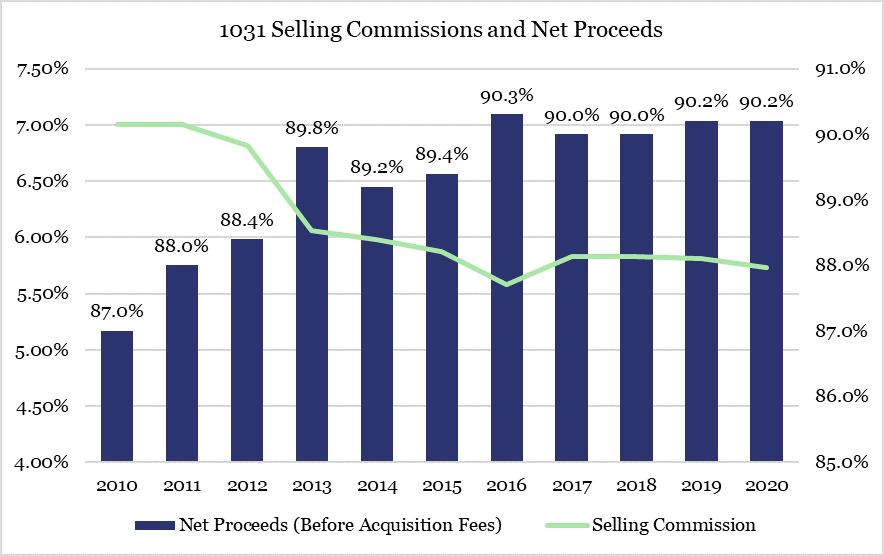
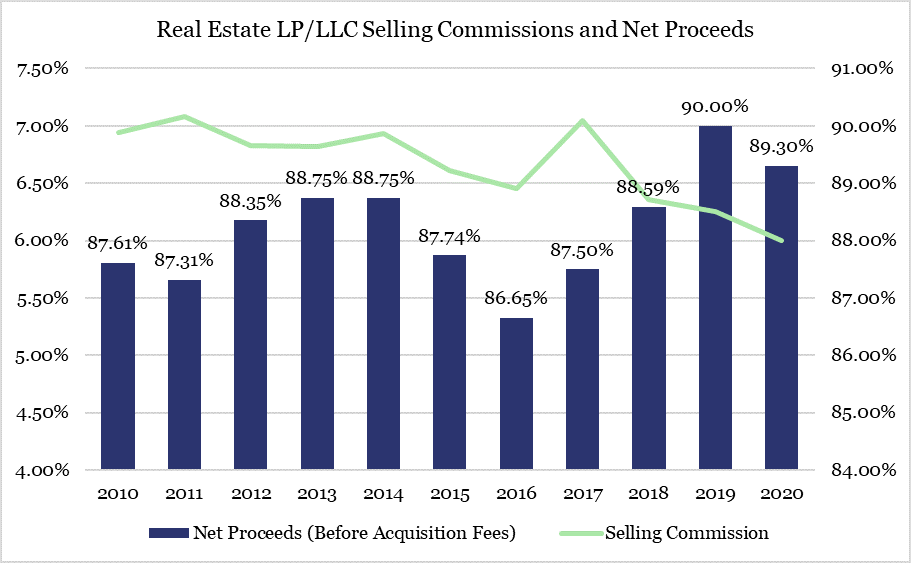
We found that up-front selling commissions have declined and net proceeds before acquisition fees has increased for 1031 exchanges and non-1031 real estate private placements over the last decade.
1031 selling commissions went from an average of 7% in 2010 to 5.73% for programs that opened in 2020, while the average net proceeds increased from 87 to 90.2%. This is a difference of approximately $3,200 on a $100,000 investment.
Results are similar for non-1031 real estate LPs and LLCs, with selling commissions declining from an average of 6.94% in 2010 to 6% in 2020. Net proceeds are up from 87.61% in 2010 to 89.30% in 2020 for a difference of $2,390 per $100,000 investment.
When looking at fees over time for real estate private placements, it appears the industry has responded to regulatory focus over the last decade by reducing up-front fees and expenses; even for private placements that may not be applicable to FINRA Regulatory Notice 15-02. However, real estate by its very nature can be an expensive asset class.
It is important to remember that although it may be good to see up-front fees decline, there are many other fees and expenses related to owning and operating direct real estate that must be considered reasonable including, but not limited to, construction costs, acquisition-related expenses, financing costs, leasing commissions, insurance and legal costs, and property management fees.
Monday, March 9th, 2020 and is filed under Industry Reporting
We recently released our February Private Placement Insights. See the highlights from the report below, or if you are an AI Insight Premium Reporting subscriber, log in now to see the entire report.
• 16 new private placements were added to our coverage in February, just below the last couple of months but still well over last year’s levels. The industry is again being led by the real estate focused categories including 1031s and real estate LPs and LLCs.
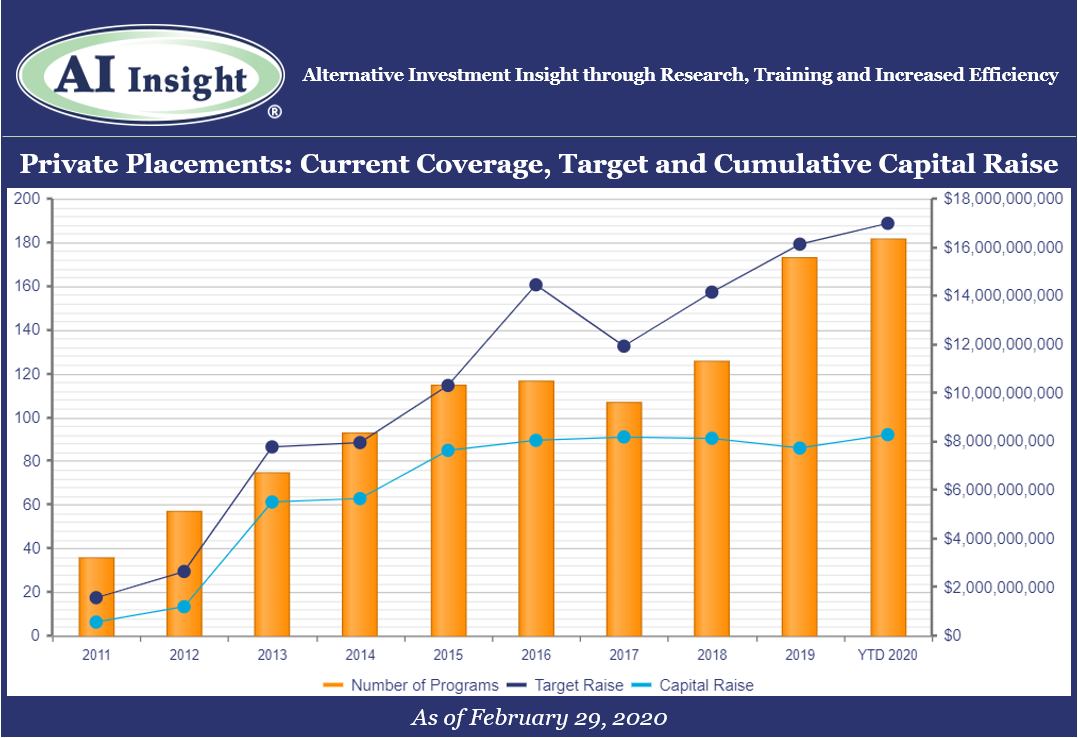
• As of March 1st, AI Insight covers 182 private placements currently raising capital, with an aggregate target raise of $17.0 billion and an aggregate reported raise of $8.3 billion or 49% of target. The average size of the current funds is $92.6 million, ranging from $3.5 million for a single asset real estate fund to $2.2 billion for a sector specific private equity/debt fund.
• 13 private placements closed in February, having raised approximately 87% of their target and having been on the market for an average of 393 days.
• ON DECK: as of March 1st, there were eight new private placements coming soon.
Access the full Private Placements report and other hard-to-find alts data
AI Insight’s Industry Reporting capabilities help you review alternative investment trends and historical market data for Private Placements, Non-Traded REITs, BDCs, Closed-End Funds, and Alternative Mutual Funds. Receive up to 24 extensive reports per year to help broaden your alternative investment reviews.
Log in or subscribe to AI Insight to further research, sort, compare, and analyze all of the private and public funds in our coverage universe. See who’s new in the industry and what trends are impacting the alts space.
_________________________________
Chart and data as of Feb. 29, 2020, based on programs activated on the AI Insight platform as of this date.
Activated means the program and education module are live on the AI Insight platform. Subscribers can view and download data for the program and access the respective education module.
On a subscription basis, AI Insight provides informational resources and training to financial professionals regarding alternative investment products and offerings. AI Insight is not affiliated with any issuer of such investments or associated in any manner with any offer or sale of such investments. The information above does not constitute an offer to sell any securities or represent an express or implied opinion on or endorsement of any specific alternative investment opportunity, offering or issuer. This report may not be shared, reproduced, duplicated, copied, sold, traded, resold or exploited for any purpose. Copyright ©2020 AI Insight. All Rights Reserved.
Tuesday, February 11th, 2020 and is filed under Industry Reporting
We recently released our January Private Placement Insights. See the highlights from the report below, or if you are a subscriber, log in now to see the entire report.
- 17 new private placements were added to our coverage in January, less than December’s record month, but higher on a year-over-year basis. The industry is again being led by 1031 exchanges, although target raise is higher than last year in all but one category.
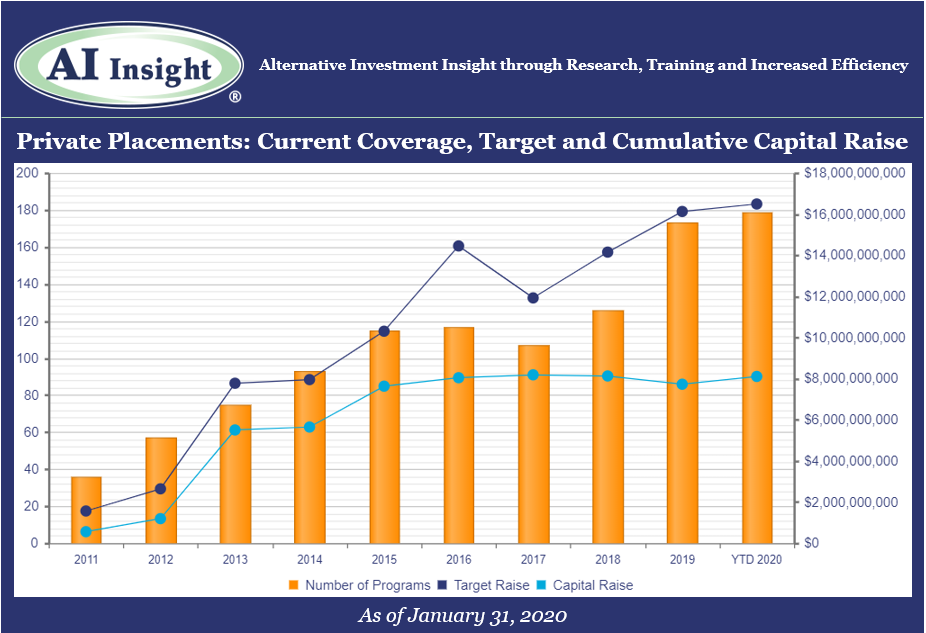
- As of February 1st, AI Insight covers 179 private placements currently raising capital, with an aggregate target raise of $16.5 billion and an aggregate reported raise of $8.1 billion or 49% of target. The average size of the current funds is $92.1 million, ranging from $3.4 million for a single asset real estate fund to $2.2 billion for a sector specific private equity/debt fund.
- 13 private placements closed in January, having raised approximately 96% of their target.
- ON DECK: as of February 1st, there were 11 new private placements coming soon.
Access the full Private Placements report and other hard-to-find alts data
AI Insight’s Industry Reporting capabilities help you review alternative investment trends and historical market data for Private Placements, Non-Traded REITs, BDCs, Closed-End Funds, and Alternative Mutual Funds. Receive up to 24 extensive reports per year to help broaden your alternative investment reviews.
Log in or subscribe to AI Insight to further research, sort, compare, and analyze all of the private and public funds in our coverage universe. See who’s new in the industry and what trends are impacting the alts space.
_________________________________
Chart and data as of Jan. 31, 2020, based on programs activated on the AI Insight platform as of this date.
Activated means the program and education module are live on the AI Insight platform. Subscribers can view and download data for the program and access the respective education module.
On a subscription basis, AI Insight provides informational resources and training to financial professionals regarding alternative investment products and offerings. AI Insight is not affiliated with any issuer of such investments or associated in any manner with any offer or sale of such investments. The information above does not constitute an offer to sell any securities or represent an express or implied opinion on or endorsement of any specific alternative investment opportunity, offering or issuer. This report may not be shared, reproduced, duplicated, copied, sold, traded, resold or exploited for any purpose. Copyright ©2020 AI Insight. All Rights Reserved.
